Time Zone: GMT +2
Time Frame: 4 Hours (H4)
Fundamental Analysis
The Australian Dollar faces a cautious outlook following the Westpac-Melbourne Institute Leading Index report, which indicates stalling economic momentum and a shift toward a more subdued growth trajectory of 2.4% for 2026. This domestic cooling is contrasted by a pivotal day for the US Dollar, driven by heavy-hitting Federal Reserve data including Industrial Production (forecasted at 0.1%) and Capacity Utilization (expected at 76.1%). Furthermore, hawkish commentary is anticipated from FOMC members Michelle Bowman and Philip Jefferson, whose speeches today regarding monetary policy implementation could strengthen the Greenback if they reinforce a “higher-for-longer” interest rate stance. Consequently, the AUD USD fundamental analysis suggests a bearish bias for the Aussie as the USD capitalizes on its role as a leading indicator of economic health and potential consumer inflation.
Price Action
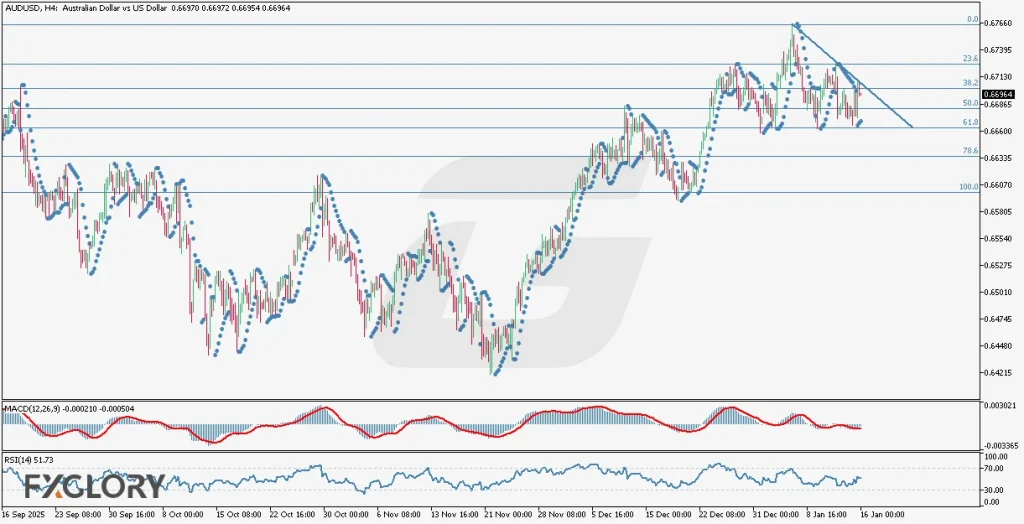
The price action on the AUDUSD H4 chart confirms that the recent bullish trend has been decisively broken, transitioning into a descending way of movement. Following a period of sideways consolidation, a short-term trendline has formed, guiding the price lower as sellers take control of the market. The current structure suggests that the pair is seeking a new floor, with the immediate focus on key psychological levels as the previous upward momentum completely dissipates.
Key Technical Indicators
Parabolic SAR: Despite the descending price movement, the Parabolic SAR dots have not yet flipped to the top of the candles, indicating a lag in the reversal signal. Currently, the last three parabolic spots remain placed below the candles, suggesting that while the trend is weakening, the official “stop and reverse” point hasn’t been triggered on this specific indicator yet.
MACD (12, 26, 9): The MACD oscillator confirms a bearish shift in momentum with values currently sitting at -0.000210 and -0.000504. This negative alignment shows that the short-term momentum is dropping significantly relative to the long-term trend, supporting the bearish outlook seen in the price action.
RSI (14): The RSI 14 is currently positioned at 51.73, reflecting a neutral state after the recent break of the uptrend. This reading suggests there is no immediate overbought or oversold pressure, giving the price plenty of room to continue its downward trajectory toward support before reaching extreme levels.
Support and Resistance
Support: Major support is identified at 0.6663, aligning with the 61.8% Fibonacci retracement level and the recent swing lows.
Resistance: The nearest resistance level is found at 0.6727, which marks the upper boundary of the recent consolidation and the start of the descending trendline.
Conclusion and Consideration
The AUD-USD H4 technical analysis suggests a bearish outlook as the pair breaks its bullish structure and moves into a descending phase. While the Parabolic SAR has yet to flip, the MACD and Fibonacci targets point toward further downside potential. Traders should exercise caution and monitor the 50.0% and 61.8% levels closely, especially with the high-impact USD news and Fed speeches scheduled for today.
Disclaimer: The analysis provided for AUD/USD is for informational purposes only and does not constitute investment advice. Traders are encouraged to perform their own analysis and research before making any trading decisions on AUDUSD. Market conditions can change quickly, so staying informed with the latest data is essential.