Time Zone: GMT +2
Time Frame: 4 Hours (H4)
Fundamental Analysis:
The GOLD/USD (Spot Gold vs US Dollar) market is under the influence of several key macroeconomic indicators today. U.S. crude oil inventories data is scheduled, and a lower-than-forecast number could signal reduced energy demand, indirectly influencing inflation expectations and, by extension, gold prices. Additionally, real estate-related releases including the House Price Index (HPI) from FHFA and the S&P Case-Shiller Index are due later, which may affect USD sentiment depending on housing market strength. Investors are also eyeing Chicago PMI data for clues about regional economic activity and momentum. Given gold’s inverse relationship with the USD, stronger-than-expected US economic data may exert downward pressure on gold, while any signs of weakness could bolster its safe-haven appeal.
Price Action:
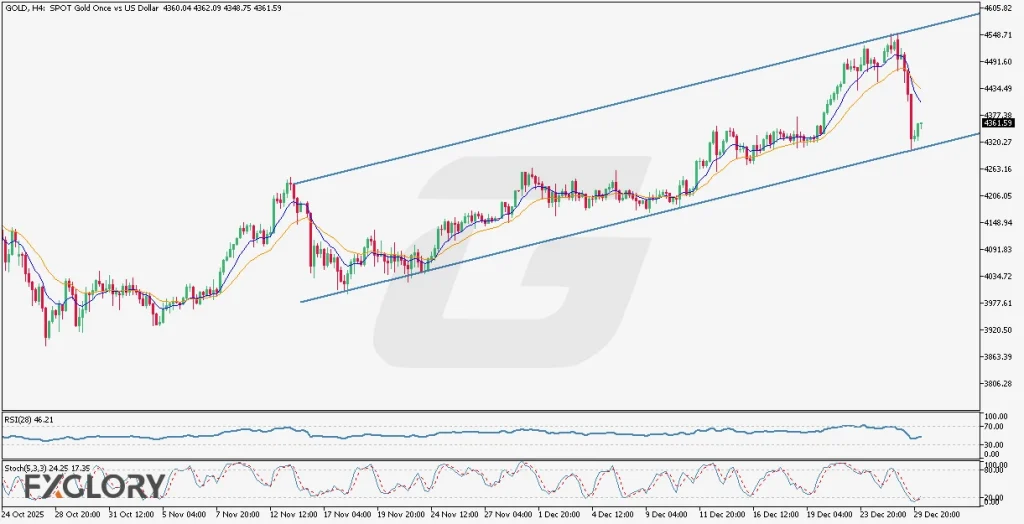
GOLD on the H4 chart is currently trading within a well-established ascending price channel. After reaching a new all-time high around 4549.00, the price sharply corrected downwards, touching the lower boundary of the ascending channel where it found support. The most recent three candlesticks have turned green, indicating a potential bullish reversal or at least a corrective bounce from the channel’s lower trendline. The market structure suggests bullish continuation remains valid unless price breaks and closes below the lower channel support.
Key Technical Indicators:
Moving Averages (9 & 21): The 9-period EMA (blue) has recently crossed below the 21-period EMA (orange), a short-term bearish crossover indicating downside momentum. However, with the price rebounding off the channel support and three consecutive bullish candles forming, this could signal an early shift in momentum if confirmed by further upside movement.
Relative Strength Index (RSI 28): The RSI is currently at 46.21, which is just below the neutral 50 level. This suggests that the market is neither overbought nor oversold, and has room to recover. A break above 50 would support bullish momentum resumption in the XAU/USD H4 chart outlook.
Stochastic Oscillator (5,3,3): The Stochastic Oscillator is at 24.25 (K) and 17.35 (D), positioning it in the oversold territory. This indicates that a short-term bullish reversal may be underway, especially as it aligns with the price bouncing off the ascending channel’s support line.
Support and Resistance:
Support: Immediate support lies at the ascending channel’s lower boundary near the 4300.00 region, acting as a strong technical floor.
Resistance: Overhead resistance is noted near the recent swing high around 4549.00, aligning with the upper boundary of the bullish channel.
Conclusion and Consideration:
GOLD (XAU/USD) on the 4-hour chart shows signs of a technical correction within a broader bullish trend channel. After a significant pullback from all-time highs, the price action suggests a potential rebound, supported by oversold Stochastic levels and key support holding firm. The moving averages indicate short-term weakness, but this may shift if price continues upward in upcoming sessions. Traders should monitor today’s USD news releases, especially energy and housing data, as they could provide volatility triggers. As always, use sound risk management, particularly in response to macroeconomic data and the market’s reaction.
Disclaimer: The analysis provided for GOLD/USD is for informational purposes only and does not constitute investment advice. Traders are encouraged to perform their own analysis and research before making any trading decisions on GOLDUSD. Market conditions can change quickly, so staying informed with the latest data is essential.