Time Zone: GMT +2
Time Frame: 4 Hours (H4)
Fundamental Analysis:
The NZD/USD currency pair analysis indicates potential low liquidity due to New Zealand banks being closed in observance of Christmas Day, resulting in irregular volatility today. Traders should be cautious, as the absence of regular market participants may lead to unexpected market movements. Additionally, the upcoming U.S. Initial Jobless Claims report, scheduled for release on December 31, 2025, is expected to provide important signals regarding the U.S. economic health, potentially influencing USD strength.
Price Action:
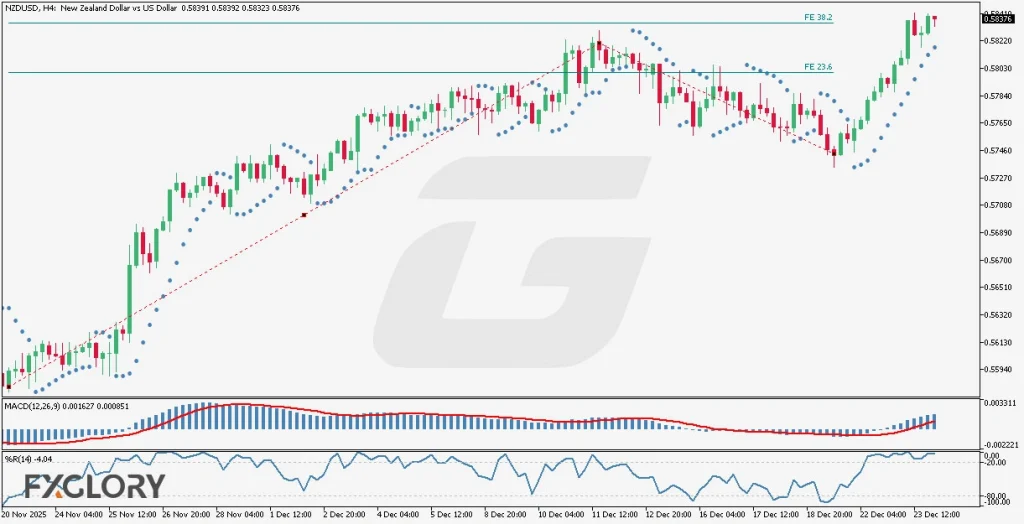
Analyzing NZDUSD price action on the H4 chart reveals sustained bullish momentum characterized by shallow corrective phases. Recently, the candles exhibited a sharp upward movement, confirming a hidden bullish divergence. Currently, the price is testing the Fibonacci expansion level of 38.2, where momentum remains robust. Given this strong momentum, the NZDUSD pair may experience minor corrections or advance further towards the next Fibonacci expansion levels.
Key Technical Indicators:
Parabolic SAR: The dots are positioned below the candles, clearly signaling continued bullish strength and upward momentum for NZDUSD. Traders may interpret this as an indicator of potential continuation rather than reversal.
MACD (12,26,9): The MACD indicator is currently at 0.001627, above the signal line at 0.000851, supporting bullish momentum. The histogram bars are expanding positively, suggesting increasing bullish sentiment in the market.
William %R (14): With a reading of -4.04, the Williams %R indicator is currently in the overbought territory. This suggests bullish dominance but also implies potential for minor pullbacks as traders may begin profit-taking.
Support and Resistance:
Support: Immediate technical support for NZDUSD is identified around the previous resistance-turned-support level near 0.5800. This level could act as a floor for short-term corrective movements.
Resistance: The next notable resistance level is seen around the Fibonacci expansion level of 61.8, slightly above the current trading zone at approximately 0.5865.
Conclusion and Consideration:
The H4 technical and fundamental chart daily analysis for NZDUSD shows strong bullish momentum, supported by the Parabolic SAR, MACD, and Williams %R indicators. While the pair currently faces minor resistance at the 38.2 Fibonacci expansion level, ongoing upward momentum may facilitate further gains. Traders should, however, be cautious due to low liquidity and possible volatility spikes driven by the holiday season.
Disclaimer: The analysis provided for NZD/USD is for informational purposes only and does not constitute investment advice. Traders are encouraged to perform their own analysis and research before making any trading decisions on NZDUSD. Market conditions can change quickly, so staying informed with the latest data is essential.