Time Zone: GMT +2
Time Frame: 4 Hours (H4)
Fundamental Analysis:
Ethereum (ETH) is consolidating near the $3,000 psychological level against the US Dollar amid a flurry of high-impact USD economic events scheduled for today. The US dollar may see increased volatility due to several key economic data releases delayed by the recent government shutdown. These include the ADP National Employment Report (NER Pulse), GDP q/q, Durable Goods Orders, Capacity Utilization Rate, and Industrial Production. A stronger-than-expected ADP employment change or GDP release could strengthen the USD, thereby exerting downside pressure on ETHUSD. Conversely, any weakness in these reports may support ETH prices in the short term. Given the macroeconomic uncertainty, ETH USD traders should remain cautious and monitor today’s releases closely as they could heavily influence market sentiment and direction.
Price Action:
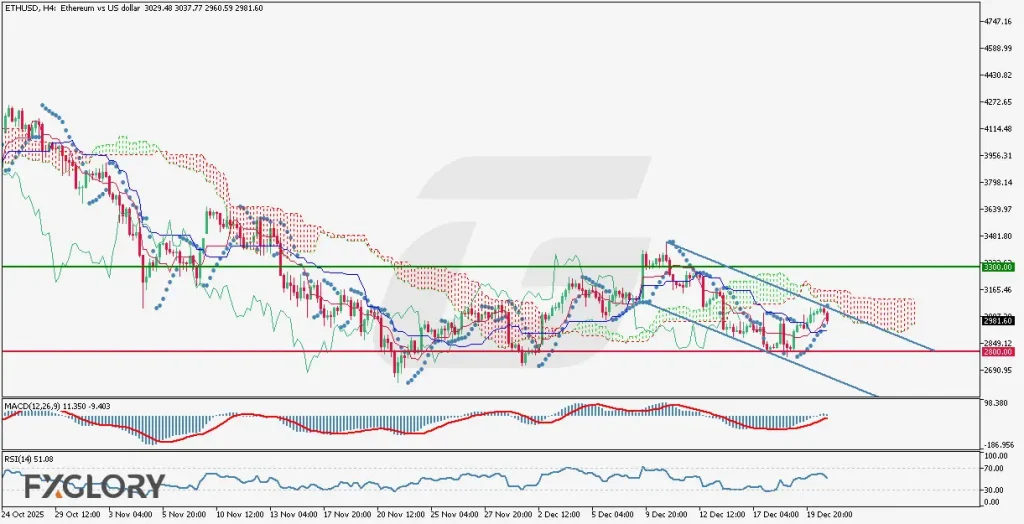
The Ethereum price has been fluctuating horizontally following a significant downtrend. Price action on the H4 chart indicates that ETHUSD has broken below the $3,300 level, which now acts as a strong resistance. The price is currently consolidating just under the $3,000 psychological barrier, with multiple failed attempts to break above. A bearish descending channel has formed, suggesting a continuation pattern. The lower boundary around $2,800 acts as a key support zone, holding prices from further decline. Price movement remains cautious and traders are awaiting clear signals either from macroeconomic news or a breakout of the descending channel.
Key Technical Indicators:
Ichimoku Cloud: ETHUSD is trading below the Ichimoku Cloud, which has turned red — indicating bearish momentum. The cloud is narrowing, suggesting a potential squeeze or breakout. While the lower band of the cloud is beginning to curve upwards, the price remains under pressure and below the Kijun-sen and Tenkan-sen lines. A breakout above the cloud is necessary to confirm a shift in momentum toward bullish territory.
MACD (12,26,9): The MACD line is currently at 11.350, and the signal line is at -9.403, showing signs of a possible bullish crossover. The histogram bars are gradually turning positive, suggesting that bearish momentum is weakening. If the crossover confirms, it could indicate a short-term reversal or at least a test of upper resistance levels.
RSI (14): The Relative Strength Index stands at 51.08, reflecting a neutral stance. The RSI is neither in the overbought nor oversold territory, implying a lack of strong directional momentum. Traders should wait for a breakout above 60 or a dip below 40 to confirm a trend continuation or reversal.
Parabolic SAR: The Parabolic SAR dots had been consistently forming below the candles, supporting a bullish correction. However, the most recent SAR dot has flipped to appear above the current candle, signaling a possible end to the short-term bullish momentum and a potential return to bearish pressure.
Support and Resistance Levels:
Support: The $2,800 level acts as immediate support and has held strong during recent dips. A breakdown below this could open the way to $2,700 and lower levels.
Resistance: The $3,000 psychological level is the first major resistance, followed by $3,300, which aligns with the previous breakdown zone and the upper boundary of the descending channel.
Conclusion and Consideration:
The ETH-USD H4 technical and fundamental chart analysis suggests that the pair is in a consolidation phase below key psychological and technical levels. Despite signs of weakening bearish momentum, Ethereum remains confined within a descending channel with no confirmed breakout. MACD and RSI hint at a potential reversal, but confirmation is still needed. Given today’s packed US economic calendar — with ADP employment, GDP, durable goods orders, and factory output data due — traders should be cautious and expect potential volatility. A strong USD reaction could suppress ETH, while weak USD data might offer Ethereum a chance to reclaim $3,000 and challenge $3,300 again.
Disclaimer: The analysis provided for ETH/USD is for informational purposes only and does not constitute investment advice. Traders are encouraged to perform their own analysis and research before making any trading decisions on ETHUSD. Market conditions can change quickly, so staying informed with the latest data is essential.