Time Zone: GMT +2
Time Frame: 4 Hours (H4)
Fundamental Analysis:
The BTCUSD pair remains influenced significantly by upcoming US economic events and speeches. Today, investors anticipate remarks from the US President regarding economic policies, potentially impacting USD volatility. Additionally, the Energy Information Administration (EIA) data concerning crude oil inventory could affect market sentiment indirectly, reflecting risk appetite and USD strength, consequently affecting the BTCUSD pair. Traders should closely monitor these events, as they can trigger sharp market reactions influencing short-term Bitcoin valuations.
Price Action:
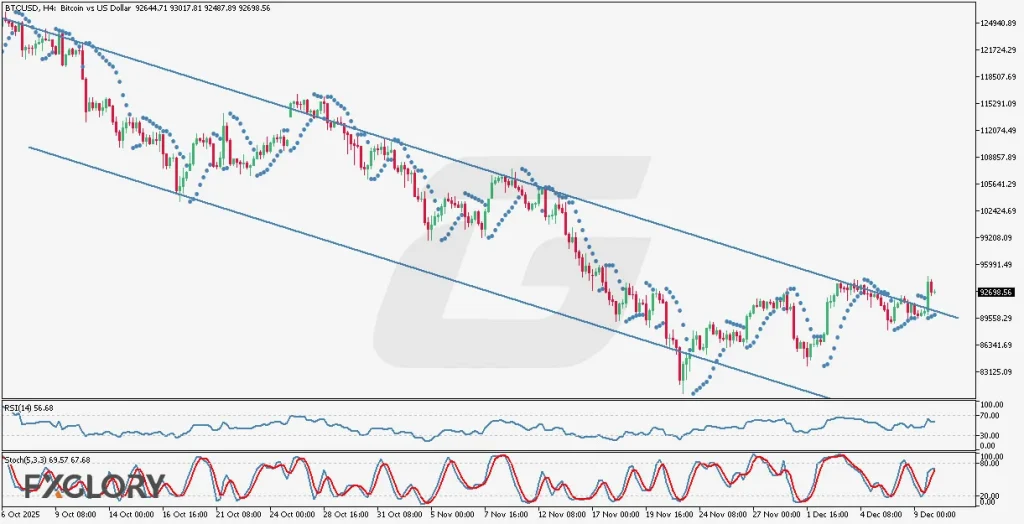
Analyzing BTCUSD price action on the H4 timeframe, the pair has exhibited a predominantly bearish movement within a descending channel. Recently, BTCUSD has shown breakout failures, indicating continued bearish sentiment. Although the candles have now broken above the channel, the pattern’s history suggests caution, as this breakout could also fail. However, given the long-term bullish nature of Bitcoin, a reversal to an upward trend is expected in the near future, pending confirmation.
Key Technical Indicators:
Parabolic SAR: Currently, the Parabolic SAR dots are below the candles, suggesting short-term bullish momentum in the BTCUSD market. Traders might consider this an early signal for potential trend reversal if sustained above the bearish channel.
RSI (14): With an RSI reading of 56.68, BTCUSD remains in neutral territory, neither overbought nor oversold. This indicates moderate bullish potential, leaving room for additional upward movement before reaching overbought conditions.
Stochastic (5, 3, 3): The Stochastic oscillator at 69.57 and 67.68 demonstrates a bullish bias but is nearing the overbought zone. Traders should be wary of potential short-term retracements due to profit-taking near resistance levels.
Support and Resistance:
Support: Immediate support for BTCUSD is established near the lower channel line, around the recent low at approximately $89,000, providing a critical psychological barrier.
Resistance: The nearest resistance is observed around the recent breakout high at approximately $93,500, serving as an immediate test point for continued bullish momentum.
Conclusion and Consideration:
BTCUSD analysis on the H4 chart suggests a cautious approach. The recent breakout from the bearish channel could indicate a bullish reversal, but confirmation is necessary to ensure sustainable upward momentum. Key indicators support a bullish scenario in the short term, though traders must closely monitor upcoming USD economic data and political events, as these can significantly influence market dynamics and BTC price volatility.
Disclaimer: The analysis provided for BTC/USD is for informational purposes only and does not constitute investment advice. Traders are encouraged to perform their own analysis and research before making any trading decisions on BTCUSD. Market conditions can change quickly, so staying informed with the latest data is essential.