Time Zone: GMT +2
Time Frame: 4 Hours (H4)
Fundamental Analysis:
The AUDUSD pair’s fundamental analysis today is significantly influenced by several upcoming economic releases from Australia and the United States. Australia will release data on consumer inflation (MI CPI), ANZ job advertisements, corporate profits, and commodity prices. Stronger-than-forecasted numbers in these indicators generally strengthen the AUD, reflecting robust economic activity and increasing confidence in Australia’s economic health. On the US side, Purchasing Managers’ Index (PMI) data from S&P Global and ISM, along with ISM Manufacturing Prices, will provide critical insights into the US economic outlook, potentially affecting the USD significantly depending on whether the results outperform or underperform market forecasts.
Price Action:
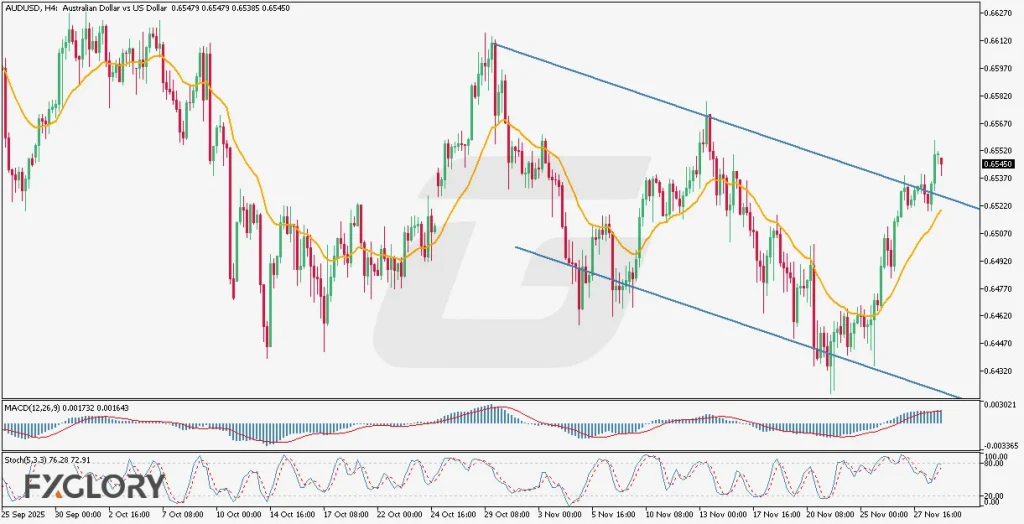
The AUDUSD pair on the H4 timeframe recently broke out from a bearish channel, yet the latest red candle signals potential uncertainty in the breakout’s sustainability. Despite a prolonged bullish phase, price action suggests this might be a breakout failure, potentially resulting in renewed bearish momentum toward the channel’s mid-band. Traders should carefully monitor the upcoming candle formations for additional bearish confirmations or bullish reversals.
Key Technical Indicators:
Moving Average: The moving average currently lies below the price candles, suggesting recent bullish strength. However, the indicator shows early signs of turning downward, hinting at a possible resumption of bearish sentiment in the near term.
MACD (12, 26, 9): MACD at 0.001732 and the signal line at 0.001643 indicate a marginally bullish stance. However, the close proximity of the lines suggests weakening bullish momentum, raising caution for potential bearish crossover and reversal.
Stochastic (5, 3, 3): The stochastic oscillator is positioned at 76.28 and 72.91, near the overbought region. This signals potential exhaustion of bullish momentum and possible reversal toward bearish sentiment if the indicator crosses downward decisively.
Support and Resistance:
Support: Immediate technical support can be identified at approximately 0.6500, aligning with the mid-band of the recent bearish channel.
Resistance: Immediate resistance is placed near 0.6570, corresponding to recent highs reached during the attempted breakout.
Conclusion and Consideration:
Technical indicators suggest caution regarding the recent bullish breakout, pointing towards a possible bearish continuation or consolidation. Upcoming economic data releases from Australia and the US could catalyze significant volatility, potentially validating or negating current technical setups. Traders should closely watch price action around key support and resistance levels, alongside economic releases for informed trading decisions.
Disclaimer: The analysis provided for AUD/USD is for informational purposes only and does not constitute investment advice. Traders are encouraged to perform their own analysis and research before making any trading decisions on AUDUSD. Market conditions can change quickly, so staying informed with the latest data is essential.