Time Zone: GMT +2
Time Frame: 4 Hours (H4)
Fundamental Analysis:
The Gold market today is heavily influenced by the upcoming USD economic indicators and speeches by Federal Reserve officials. USD will experience potential volatility due to the Treasury International Capital data release, delayed because of a government shutdown, affecting foreign investment balances. Speeches by FOMC members including Lorie Logan, Stephen Miran, Thomas Barkin, and John Williams may offer insights on monetary policy, thus creating significant market movements and influencing Gold prices inversely to the strength of the USD.
Price Action:
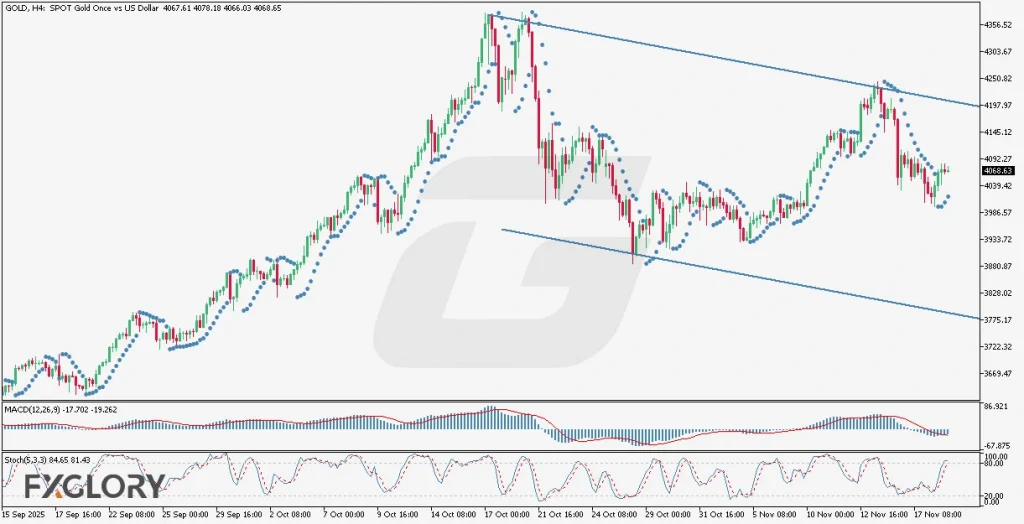
Gold’s H4 chart analysis depicts the market entering a consolidation period after a pronounced bullish run. The price currently oscillates within a bearish channel, indicating the potential for either bearish continuation or bullish reversal from current levels. Recent price action shows a corrective bullish move, although sharp bullish momentum seems improbable given the current bearish strength. Traders should closely observe the upper and lower boundaries of this bearish channel for potential breakout opportunities.
Key Technical Indicators:
Parabolic SAR: Dots are currently below the candles, suggesting a short-term bullish sentiment. This could imply a possible test towards the resistance line of the bearish channel, though caution is advised due to overall bearish pressure.
MACD: With values at -17.702 and -19.262, the MACD indicator signals bearish momentum but with a narrowing histogram, hinting at weakening selling pressure. Traders should watch for potential bullish crossovers as an early sign of a trend reversal.
Stochastic: Current readings of 84.65 and 81.43 indicate overbought conditions, signaling a possible exhaustion of the recent bullish move. A bearish reversal may occur, pushing prices back towards support levels.
Support and Resistance:
Support: Immediate support is located at the lower boundary of the bearish channel around recent lows, serving as a critical pivot for bearish continuation.
Resistance: The nearest resistance is defined by the upper boundary of the bearish channel, aligning with previous highs and acting as a crucial breakout point.
Conclusion and Consideration:
The H4 technical and fundamental chart analysis suggests Gold is presently in a transitional phase, trapped within a bearish channel, with limited bullish prospects. Upcoming USD news and Fed speeches are expected to create significant volatility, potentially driving prices out of the current consolidation. Traders should cautiously monitor price action near channel boundaries and technical indicator shifts.
Disclaimer: The analysis provided for XAU/USD is for informational purposes only and does not constitute investment advice. Traders are encouraged to perform their own analysis and research before making any trading decisions on XAUUSD. Market conditions can change quickly, so staying informed with the latest data is essential.