Time Zone: GMT +2
Time Frame: 4 Hours (H4)
Fundamental Analysis:
The USDCAD currency pair is positioned ahead of a high-impact day for both the US Dollar and the Canadian Dollar, making this H4 forex forecast especially sensitive to incoming economic data. On the USD side, traders will closely monitor the New York Manufacturing Index, which serves as a leading indicator of US economic health, as well as speeches from FOMC members John Williams and Philip Jefferson. Any hawkish tone may support the USD through expectations of tighter monetary policy. Additionally, delayed releases from the Census Bureau and Treasury Budget may influence market sentiment as the data backlog clears. For the CAD, a heavy cluster of inflation-related releases—including CPI, CPI Median, CPI Trim, and CPI Ex Volatile Items—will play a key role. Stronger-than-forecast Canadian inflation typically strengthens the CAD due to higher rate expectations from the Bank of Canada, increasing volatility in the USDCAD H4 chart around release times.
Price Action:
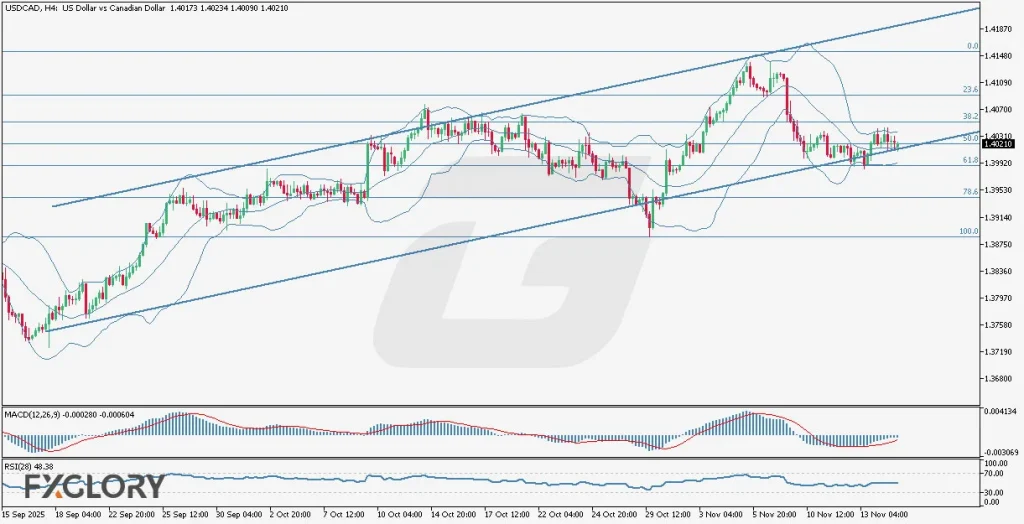
The USD-CAD price action on the H4 timeframe continues to respect a well-defined ascending bullish channel, with price oscillating between the lower and upper trend boundaries. Recent candles show consolidation around the 50% Fibonacci retracement, which aligns closely with the middle Bollinger Band, suggesting a temporary equilibrium between buyers and sellers. The price has recently moved from the lower Bollinger Band back toward the middle and upper half of the channel, indicating stabilizing bullish momentum after a corrective phase. Despite the consolidation, the broader trend structure remains upward, but traders should watch for a clean breakout from the 50% Fibonacci zone to confirm continuation.
Key Technical Indicators:
Bollinger Bands: USD/CAD is trading between the middle and upper Bands, showing mild bullish pressure. The middle Band aligns with the 50% Fibonacci level, acting as key dynamic support. Price recovery from the lower Band suggests stabilizing bullish momentum.
MACD (12,26,9): MACD values at -0.000280 / -0.000604 reflect weak bearish momentum. The histogram is contracting, signaling a possible momentum shift. A bullish crossover would confirm renewed upside strength.
RSI (28): The RSI at 48.38 indicates neutral momentum. It supports the current consolidation near the 50% Fibonacci level. There is room for movement in either direction without overbought or oversold pressure.
Support and Resistance Levels:
Support: Key support is located at the 1.3980–1.3990 zone, aligning with the lower region of the 50%–61.8% Fibonacci cluster and the bullish channel’s mid-line.
Resistance: Immediate resistance stands near 1.4065–1.4080, corresponding to the 38.2% Fibonacci level and upper channel reaction zones.
Conclusion and Consideration:
The USD-CAD H4 technical outlook remains bullish overall, but the price is currently consolidating around the critical 50% Fibonacci retracement and middle Bollinger Band. Technical indicators suggest neutral momentum with potential for bullish continuation if resistance zones break. However, given today’s heavy US and Canadian fundamental calendar, volatility spikes are expected, especially around CPI releases and FOMC member remarks. Traders should manage positions cautiously, as fundamentals may override short-term technical setups.
Disclaimer: The analysis provided for USD/CAD is for informational purposes only and does not constitute investment advice. Traders are encouraged to perform their own analysis and research before making any trading decisions on USDCAD. Market conditions can change quickly, so staying informed with the latest data is essential.