Time Zone: GMT +2
Time Frame: 4 Hours (H4)
Fundamental Analysis:
Today, USD will likely face notable volatility as Federal Reserve officials, including Governor Christopher Waller, Philadelphia President Anna Paulson, St. Louis President Alberto Musalem, New York President John Williams, and Governor Philip Jefferson, are set to speak. Hawkish commentary from these FOMC members could strengthen the USD by signaling tighter monetary policy. Concurrently, the Canadian Dollar (CAD) is also expected to experience volatility due to employment data and unemployment rates from Statistics Canada, which directly influences the economic outlook for Canada, potentially impacting CAD significantly.
Price Action:
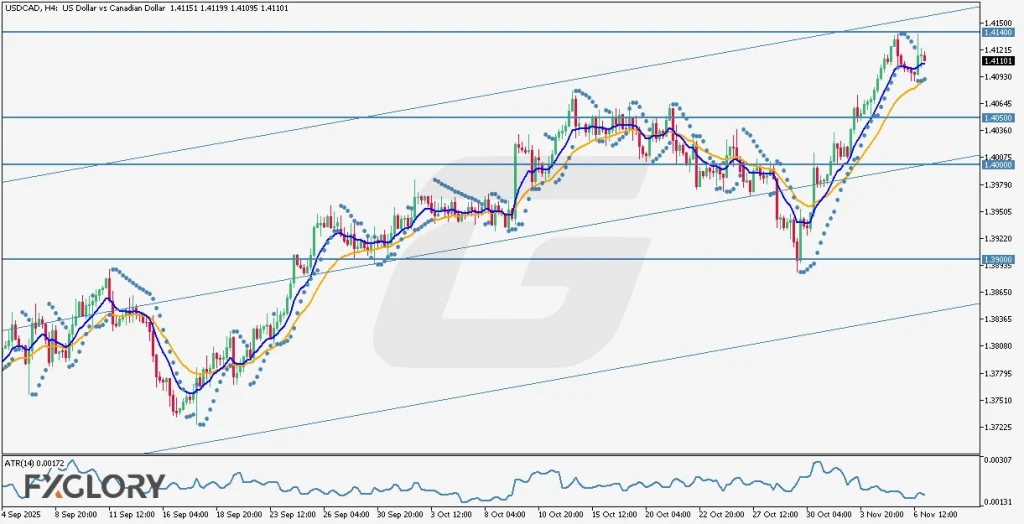
USD/CAD H4 price action analysis illustrates a bullish trend, correcting the bearish momentum faced earlier in 2025. The pair currently trades in the upper half of the regression channel, demonstrating continued upward strength. The short MA (9, blue) recently crossed above the longer MA (21, orange), confirming bullish momentum. Recent candles are supported by Parabolic SAR dots appearing beneath the price action, further validating the bullish scenario.
Key Technical Indicators:
Moving Averages (MA9 & MA21): The short-term MA9 (blue) has recently crossed above the long-term MA21 (orange), signaling a strong bullish entry indication. The price continues to trade comfortably above both MAs, providing confidence in the current bullish outlook.
Parabolic SAR: The last three dots from the Parabolic SAR indicator are located beneath the candles, touching the long-term MA. This alignment confirms bullish momentum, suggesting ongoing upward potential in the USD CAD currency pair.
Average True Range (ATR): The ATR (14) currently stands at 0.00172, indicating relatively moderate volatility. This implies that significant price movements may still occur, but drastic swings are less likely in the immediate term, aiding traders in managing their stop-loss and take-profit strategies.
Support and Resistance:
Support: Immediate psychological support is identified at the 1.40500 level, with subsequent key supports at 1.40000 and deeper at 1.39000.
Resistance: The initial resistance level is at 1.41400, functioning as a significant psychological and technical barrier.
Conclusion and Consideration:
The technical analysis for the USD-CAD H4 chart maintains a bullish bias, supported by MAs and Parabolic SAR. However, today’s key speeches from FOMC members and employment data from Canada introduce potential volatility. Traders should remain cautious and consider tightening their risk management approaches in response to fundamental news.
Disclaimer: The analysis provided for USD/CAD is for informational purposes only and does not constitute investment advice. Traders are encouraged to perform their own analysis and research before making any trading decisions on USDCAD. Market conditions can change quickly, so staying informed with the latest data is essential.