Time Zone: GMT +2
Time Frame: 4 Hours (H4)
Fundamental Analysis:
The NZDUSD currency pair is influenced today by several key macroeconomic events from both New Zealand and the United States. On the New Zealand side, upcoming reports from Statistics New Zealand on employment change, unemployment rate, and private sector labor costs—alongside the Reserve Bank of New Zealand (RBNZ) Financial Stability Report press conference with Governor Christian Hawkesby—are expected to bring notable market volatility. Traders will watch for any hawkish tone from the RBNZ that might strengthen the NZD, especially if employment data reveals job growth or stable labor costs. For the USD, focus turns to the ADP Non-Farm Employment Change, S&P Global Services PMI, ISM Non-Manufacturing PMI, and EIA Crude Oil Inventories. Strong labor and services data from the US could further bolster the dollar, maintaining pressure on the NZDUSD pair.
Price Action:
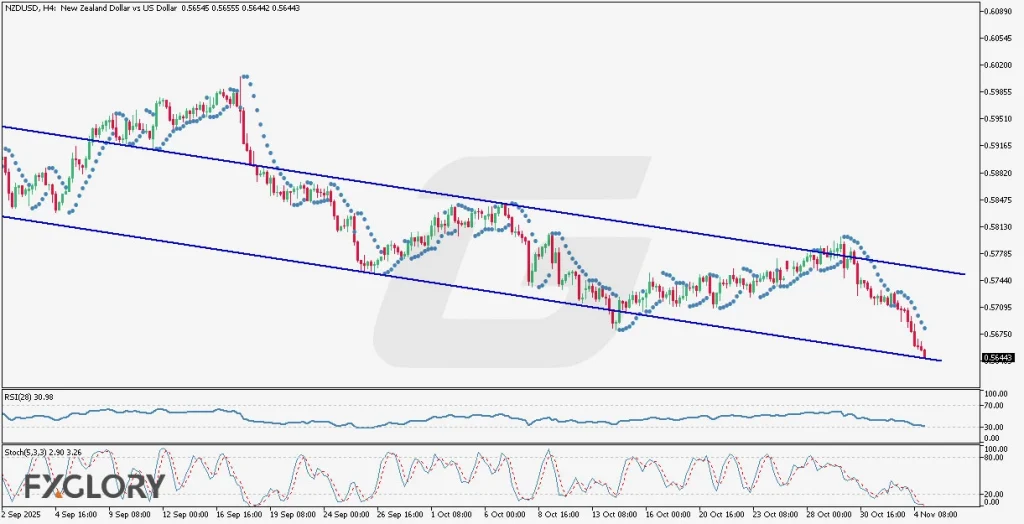
The NZDUSD pair on the H4 chart continues to trade within a well-defined bearish descending channel, showing consistent lower highs and lower lows. The candles have been moving along the channel with several breakout failures from both the upper and lower bands, confirming the prevailing downtrend. Given the recent sharp descent in price, the pair has now approached the lower boundary of the channel, suggesting the possibility of a minor corrective rebound before resuming its downward movement. However, a confirmed breakout below this lower band could signal further bearish extension, especially if US economic data outperforms expectations.
Key Technical Indicators:
Parabolic SAR: The dots are currently positioned above the candles, confirming ongoing bearish momentum. This alignment indicates that sellers remain dominant in the market, and the trend could persist unless a reversal signal occurs with dots flipping below the price.
RSI (28): The Relative Strength Index reads 30.98, hovering near the oversold territory. This suggests that the pair is approaching an area where buying interest could emerge, signaling a potential short-term correction or consolidation phase before the next directional move.
Stochastic (5,3,3): The Stochastic oscillator shows values of 2.90 (K) and 3.26 (D), both deep in oversold territory. This indicates extreme selling pressure, and although the downtrend remains strong, a technical rebound might occur soon if the indicator crosses upward, hinting at temporary bullish correction.
Support and Resistance:
Support: The nearest support level lies around 0.5630, aligning with the lower boundary of the descending channel and a recent swing low.
Resistance: The initial resistance is seen near 0.5740, coinciding with the upper band of the bearish channel and previous consolidation highs.
Conclusion and Consideration:
The NZDUSD H4 technical analysis suggests that the pair remains entrenched in a strong bearish trend, with price action confined within a downward channel. Although both RSI and Stochastic indicate oversold conditions, the Parabolic SAR supports continued bearish sentiment. Traders should watch for corrective pullbacks toward resistance levels, which may offer renewed selling opportunities if the overall bearish channel structure holds. From a fundamental perspective, upcoming New Zealand labor data and the RBNZ Governor’s remarks could inject volatility, while stronger-than-expected US employment and PMI data may further weigh on the NZD.
Disclaimer: The analysis provided for NZD/USD is for informational purposes only and does not constitute investment advice. Traders are encouraged to perform their own analysis and research before making any trading decisions on NZDUSD. Market conditions can change quickly, so staying informed with the latest data is essential.