Time Zone: GMT +2
Time Frame: 4 Hours (H4)
Fundamental Analysis:
The USD/CHF currency pair represents the exchange rate between the U.S. Dollar and the Swiss Franc. Today, several important USD news events are expected, including the S&P Global PMI, ISM Manufacturing PMI, Prices Paid, Construction Spending, and Auto Sales reports. In addition, Federal Reserve members Mary Daly and Lisa Cook are scheduled to speak, potentially providing insights into future U.S. monetary policy and interest rate outlook. Positive or hawkish remarks from these officials could strengthen the U.S. Dollar. On the Swiss side, the CPI (Consumer Price Index) and Procure PMI are due this week, which could impact the CHF by influencing market expectations about the Swiss National Bank’s (SNB) inflation stance. Overall, today’s fundamental landscape suggests moderate to high volatility for the USDCHF pair as traders digest multiple U.S. macroeconomic releases and central bank comments.
Price Action:
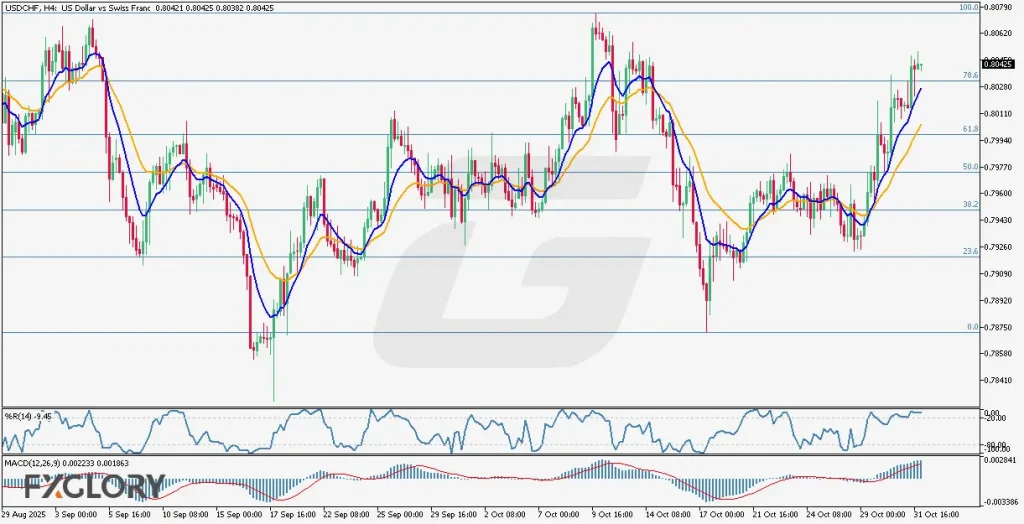
In the USD CHF H4 chart, the pair is showing a clear bullish structure as the price continues its upward movement from the 78.6% Fibonacci retracement level, heading toward the 100% retracement zone. After opening the new trading week, the first H4 candle began positively, indicating strong early buying interest. The overall price action displays higher highs and higher lows, confirming an ascending short-term trend. Buyers appear to be in control as the pair sustains momentum above key moving averages, suggesting potential continuation toward the upper Fibonacci level if bullish sentiment persists.
Key Technical Indicators:
Moving Averages (9 and 21 EMA): The blue 9-period EMA has crossed above the orange 21-period EMA, both moving upward, signaling renewed bullish momentum in the USD-CHF H4 technical analysis. This crossover, combined with the positive candle formation at the weekly open, supports an ongoing uptrend toward the 100% Fibonacci retracement level.
Williams %R (14): The %R(14) currently reads -9.45, placing the pair near the overbought zone. This suggests strong bullish pressure in the short term, but traders should monitor for potential exhaustion or short-lived corrections if the indicator remains in the extreme range for too long.
MACD (12, 26, 9): The MACD line (0.002233) is above the signal line (0.001863), and the histogram is increasing, confirming that bullish momentum remains dominant. The widening gap between both lines indicates strengthening buying power and supports the upward movement observed on the H4 timeframe.
Support and Resistance:
Support: Immediate support is found near the 0.8025–0.8035 area, aligning with the 78.6% Fibonacci retracement and the short-term moving averages, which may act as a rebound point if the price pulls back.
Resistance: The nearest resistance is located around 0.8070–0.8080, coinciding with the 100% Fibonacci level and recent swing highs, marking a potential profit-taking area for short-term traders.
Conclusion and Consideration:
The USDCHF H4 technical and fundamental chart analysis points to a bullish bias supported by upward-moving EMAs, a positive MACD, and strong price action moving from 78.6% to 100% Fibonacci retracement levels. While short-term momentum remains positive, traders should stay cautious as the %R(14) indicates overbought conditions that could trigger temporary pullbacks. With multiple key U.S. economic releases and FOMC speeches scheduled today, volatility may increase, offering both opportunities and risks.
Disclaimer: The analysis provided for USD/CHF is for informational purposes only and does not constitute investment advice. Traders are encouraged to perform their own analysis and research before making any trading decisions on USDCHF. Market conditions can change quickly, so staying informed with the latest data is essential.