Time Zone: GMT +3
Time Frame: 4 Hours (H4)
Fundamental Analysis:
The AUD-USD pair today may experience significant volatility due to important economic events from both Australia and the US. Australian employment data and unemployment rate releases from the Australian Bureau of Statistics can substantially impact the AUD, with better-than-forecast numbers likely providing strength to the Australian dollar. Additionally, Reserve Bank of Australia Assistant Governor Christopher Kent’s speech will be closely monitored for any hints regarding future monetary policy, adding another layer of potential volatility. Conversely, the US Dollar could be influenced by key speeches from several Federal Reserve Governors, including Christopher Waller, Michael Barr, Stephen Miran, and Michelle Bowman, alongside data from the Philadelphia Fed Business Outlook Survey and other economic indicators. Any hawkish commentary may provide support to the USD.
Price Action:
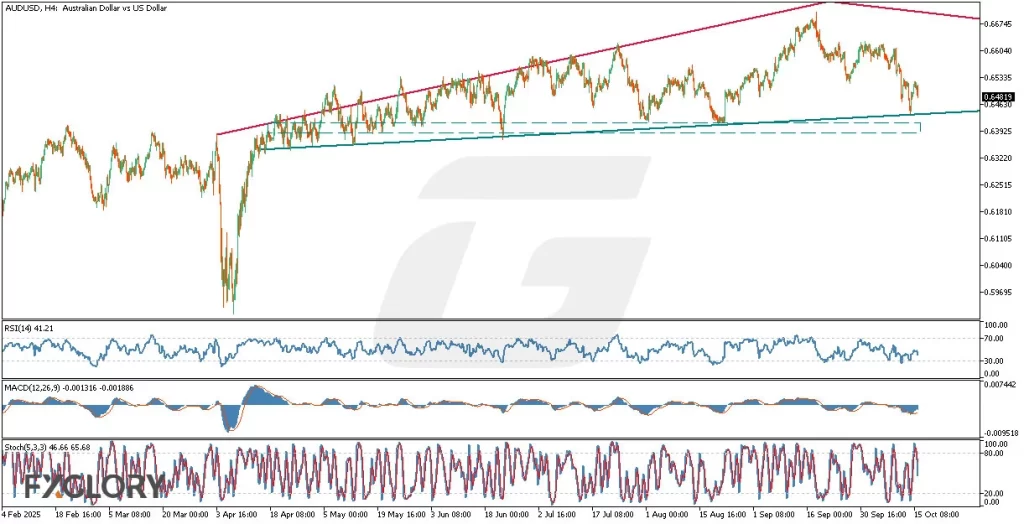
AUD/USD price analysis on the H4 timeframe indicates an ongoing uptrend, moving within a clearly defined ascending wedge. The recent price action shows a strong reaction to the lower trendline of the wedge, suggesting the possibility of a bounce upwards. If this support holds, the price could rally towards the upper trendline of the wedge. However, a decisive breakdown below this immediate support zone could open the door for further downward pressure.
Key Technical Indicators:
RSI (14): The Relative Strength Index currently stands at 41.21, signaling neutral to slightly bearish momentum. Traders should watch closely as RSI approaching 30 might indicate oversold conditions and a potential bullish reversal.
MACD (12,26,9): The MACD indicator is slightly negative (-0.001316) and remains below its signal line (-0.001886), indicating mild bearish momentum. Traders should watch for a bullish crossover as a potential reversal signal.
Stochastic Oscillator (5,3,3): Currently at 46.66 and 65.68, the Stochastic oscillator remains neutral. Traders should observe whether it moves towards the overbought or oversold zones for clearer signals regarding short-term price movements.
Support and Resistance:
Support: Immediate support levels are found at approximately 0.6430, near the ascending wedge’s lower boundary. A secondary support zone lies around 0.6390 if initial support is breached.
Resistance: Resistance is initially seen around 0.6535, coinciding with the recent swing highs. Further resistance resides near 0.6645 at the upper trendline of the wedge.
Conclusion and Consideration:
The AUD USD H4 chart analysis highlights a continuing bullish bias within an ascending wedge structure but cautions due to bearish signals from key technical indicators. Traders should closely monitor reactions at key support (0.6430, 0.6390) and resistance levels (0.6535, 0.6645). The economic calendar, featuring crucial employment data from Australia and influential speeches from US Federal Reserve officials, could significantly affect market sentiment and volatility. Trading decisions should be accompanied by strict risk management.
Disclaimer: The analysis provided for AUD/USD is for informational purposes only and does not constitute investment advice. Traders are encouraged to perform their own analysis and research before making any trading decisions on AUDUSD. Market conditions can change quickly, so staying informed with the latest data is essential.