Time Zone: GMT +3
Time Frame: 4 Hours (H4)
Fundamental Analysis:
The NZD/USD currency pair is expected to experience moderate volatility today, as the US Dollar faces low liquidity due to the Columbus Day holiday, leading to potentially irregular market movements. Additionally, the ongoing IMF meetings in Washington DC may influence investor sentiment, especially as discussions center around global economic growth and inflation. Meanwhile, the New Zealand Dollar (NZD) could gain some support from positive domestic data expectations, with the BusinessNZ Services Index and tourism arrival reports highlighting gradual recovery in the services and travel sectors. However, the global economic uncertainty and discussions from the Federal Reserve Bank of Philadelphia President Anna Paulson may provide further clues on US monetary policy, indirectly impacting NZD-USD price movements.
Price Action:
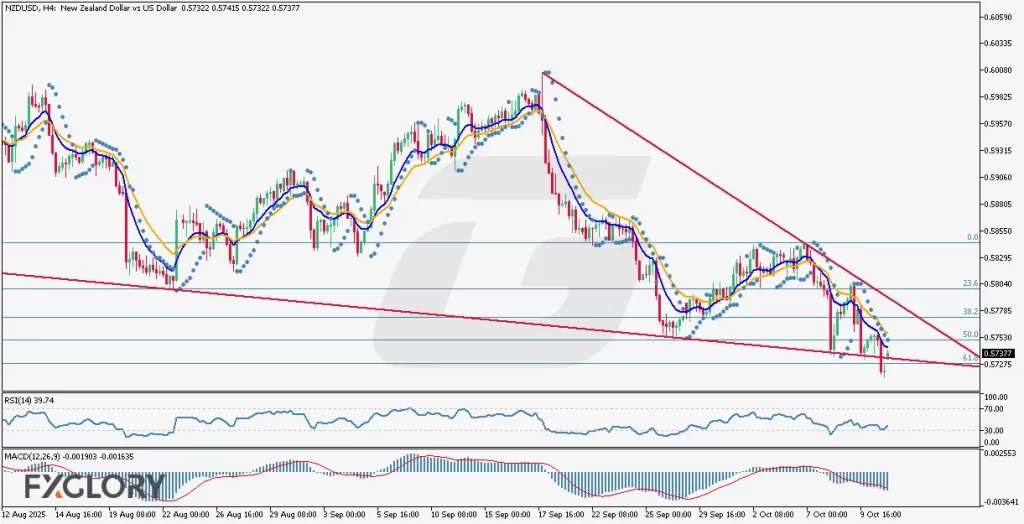
On the H4 timeframe, the NZD/USD pair remains in a bearish trend, trading between two descending trend lines acting as dynamic support and resistance. The upper resistance line is notably steeper than the lower support line, confirming sustained selling pressure. However, the latest two H4 candles turned bullish and green, bouncing from the 0.618 Fibonacci retracement level, signaling a short-term corrective rebound after touching key support. Moreover, all higher timeframes (H1, H4, Daily, and Weekly) have also printed green candles since the market opened, suggesting an early-stage correction phase or a temporary pullback within the prevailing downtrend.
Key Technical Indicators:
Moving Averages (MA 9 & MA 17): The short-term MA 9 (blue) is trading below the MA 17 (orange), with both moving downward, confirming the ongoing bearish structure. However, the gap between the two averages is narrowing slightly, which could indicate a potential slowing of bearish momentum if buyers maintain recent upward pressure.
Parabolic SAR (0.05 / 0.2): The Parabolic SAR dots remain positioned above the NZD USD price candles, which reinforces the current bearish bias. Until the dots flip below the candles, the primary trend remains downward. A reversal in SAR positioning would serve as an early confirmation of a potential bullish correction continuation.
RSI (14): The Relative Strength Index (RSI) is currently at 39.74, indicating a mildly oversold zone. The RSI line is showing signs of turning upward, reflecting possible early bullish momentum or a technical correction after extended downside pressure.
MACD (12, 26, 9): The MACD main line (-0.001903) remains below the signal line (-0.001635), maintaining a bearish stance. However, the histogram bars are shortening, signaling weakening bearish momentum and potential convergence; often a precursor to a short-term bullish crossover if buying activity continues.
Support and Resistance:
Support: Key support is observed near 0.5714 – 0.5728, aligning with the 0.618 Fibonacci retracement and lower trendline, acting as the immediate defense zone for the bulls.
Resistance: Immediate resistance is located around 0.5767 – 0.5773, coinciding with the descending trendline and the 38.2% Fibonacci retracement, representing a key level to watch for continuation or rejection of the corrective move.
Conclusion and Consideration:
The NZD/USD H4 technical and fundamental outlook shows the pair trading in a bearish trend but currently attempting a short-term bullish correction from the 0.618 Fibonacci support level. The alignment of green candles across multiple timeframes suggests improving buyer sentiment, though confirmation remains pending a breakout above the descending resistance trendline. Traders should monitor upcoming IMF discussions and any remarks from Federal Reserve officials, as they could shift USD strength and overall sentiment. Given the US Bank Holiday, market liquidity may remain thin, increasing the likelihood of irregular volatility.
Disclaimer: The analysis provided for NZD/USD is for informational purposes only and does not constitute investment advice. Traders are encouraged to perform their own analysis and research before making any trading decisions on NZDUSD. Market conditions can change quickly, so staying informed with the latest data is essential.