Time Zone: GMT +3
Time Frame: 4 Hours (H4)
Fundamental Analysis
The BTCUSD pair currently demonstrates sensitivity to ongoing financial market conditions. Today, substantial volatility might be expected given the scheduled speeches from several Federal Reserve officials, including Federal Reserve Bank Presidents Alberto Musalem, Austan Goolsbee, Lorie Logan, and Neel Kashkari, alongside Governor Michael Barr. Their statements often provide critical insights into the US monetary policy direction, directly influencing investor sentiment and, consequently, risk assets such as Bitcoin. Traders will closely monitor these speeches for hawkish or dovish signals, significantly impacting BTCUSD price movements.
Price Action
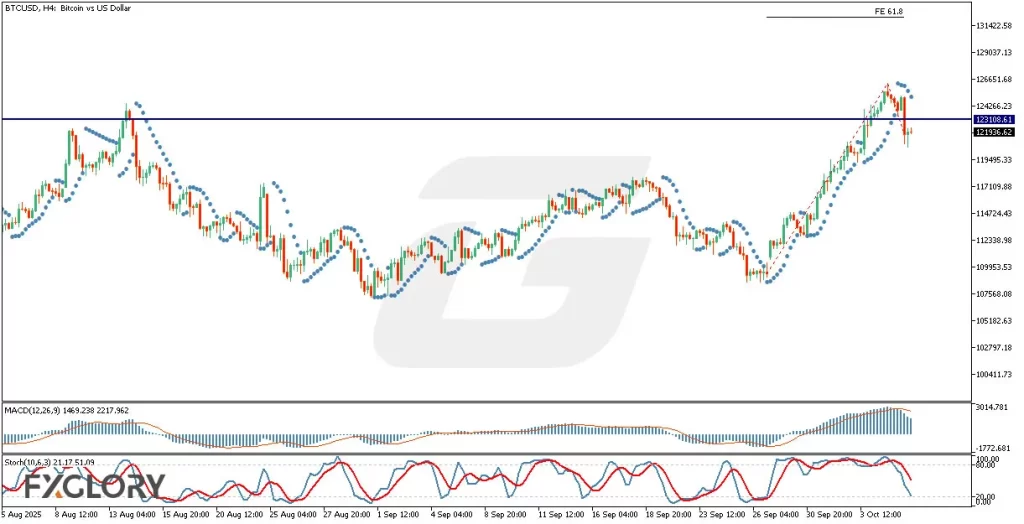
BTCUSD price action analysis in the H4 timeframe indicates a pronounced bullish movement, recently completing a sharp upward trajectory toward the key resistance zone around level 123108.61. Previously, the candles struggled and failed to break this significant price zone. However, the recent retracement below this level may be temporary, as the robust bullish sentiment from the preceding candles signals potential upward momentum. Should the price decisively break above the resistance at 123108.61, the Fibonacci expansion level 61.8 could serve as the next target.
Key Technical Indicators
MACD: The MACD histogram currently registers a level of 1469.238, while the signal line remains at 2217.962. This divergence suggests diminishing bullish momentum and cautions traders of potential short-term corrective movements, yet overall bullish bias remains intact. A bullish crossover above the signal line could reaffirm the bullish trend.
Stochastic Oscillator: The Stochastic indicator demonstrates the K% line at 21.17 and the D% line at 51.09, indicating an oversold scenario in the short term. Given these levels, traders may anticipate a potential bullish reversal soon, reinforcing the possibility of price recovery and another bullish attempt.
Parabolic SAR: The Parabolic SAR dots are positioned above the candles, highlighting short-term bearish pressure. However, considering the preceding bullish strength, the bearish move may be limited, and traders should watch for the dots shifting below the candles to confirm renewed bullish momentum.
Support and Resistance
Support: Immediate technical support is visible around the psychological level of 121396.62, aligning with recent pullback lows.
Resistance: The primary resistance remains firmly set at 123108.61, a critical pivot point where the previous bullish advances faced rejection.
Conclusion and Consideration
Technical indicators and recent price action in BTCUSD on the H4 chart suggest a cautiously bullish outlook. While short-term corrective pressure persists, especially as indicated by MACD and Parabolic SAR, stochastic conditions and recent bullish dominance imply the potential for a renewed upward move. Traders must remain alert to the upcoming Federal Reserve speeches, which could significantly impact market volatility and investor sentiment. Adjustments in risk management strategies are recommended during these high-impact news events.
Disclaimer: The analysis provided for BTC/USD is for informational purposes only and does not constitute investment advice. Traders are encouraged to perform their own analysis and research before making any trading decisions on BTCUSD. Market conditions can change quickly, so staying informed with the latest data is essential.