Time Zone: GMT +3
Time Frame: 4 Hours (H4)
Fundamental Analysis:
The USD/CAD currency pair is poised for moderate volatility today as multiple Federal Reserve officials are scheduled to speak, including Kansas City Fed President Jeffrey Schmid, Atlanta Fed President Raphael Bostic, and Minneapolis Fed President Neel Kashkari, all FOMC voting members known for providing policy clues. Any hawkish tone from these speeches could strengthen the USD by reinforcing expectations for tighter monetary policy. Meanwhile, the US will also release Trade Balance data, which can affect demand for the dollar through export and import performance. On the Canadian side, the International Merchandise Trade report is due, which may support the CAD if exports outperform expectations. Overall, fundamental sentiment appears mixed, with USD data and speeches leaning slightly bullish, while CAD’s trade data may provide some counterbalance.
Price Action:
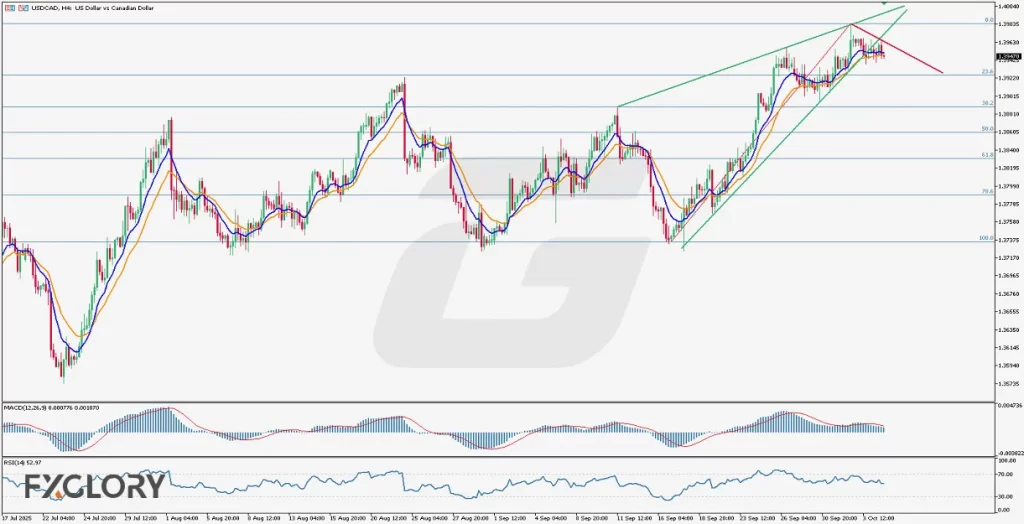
In the USD/CAD H4 timeframe, the pair has been in a bullish trend for the last three weeks, forming higher highs within an ascending wedge pattern. However, the recent candles show weakness as four out of the last five candles are bearish, suggesting that bullish momentum is fading. The price has rejected the 0.0 Fibonacci level (around 1.39850) and is now moving toward the 0.236 Fibonacci retracement level (around 1.39250). A clear break below the lower green trendline could confirm a potential bearish reversal, while the current sideways action indicates indecision ahead of key US data and Fed speeches.
Key Technical Indicators:
Moving Averages (9 & 17): The 9-period MA remains slightly above the 17-period MA but both are flattening and nearly touching the last candle. The price has closed below both lines, indicating weakening bullish momentum and the potential for a short-term bearish shift.
MACD (12, 26, 9): The MACD line (0.000776) is nearing a bearish crossover with the signal line (0.001070), while the histogram is fading toward zero. This reflects declining buying pressure and hints at an upcoming momentum shift to the downside.
RSI (14): The RSI at 52.97 shows a neutral tone, hovering just above the 50 mark. Momentum is fading, and a drop below 50 would confirm growing bearish sentiment.
Support and Resistance:
Support: Immediate support is found near 1.39250, aligning with the 0.236 Fibonacci level and the lower ascending wedge boundary. A break below this could open the door to deeper correction toward 1.38800 (38.2% Fib level).
Resistance: The nearest resistance lies around 1.39850, which coincides with the wedge’s upper boundary and the 0.0 Fibonacci retracement level. Sustained movement above this could reestablish the bullish continuation.
Conclusion and Consideration:
The USDCAD H4 technical outlook shows that while the pair has been in a strong uptrend, it is now entering a potential reversal phase as bullish momentum weakens. The sideways consolidation, declining MACD, and neutral RSI all point to a possible short-term bearish correction toward the 0.236 Fibonacci level or lower. However, traders should remain cautious ahead of multiple Fed speakers and trade data releases that could inject volatility into the pair. A decisive break below the ascending trendline would confirm the shift toward a bearish USD-CAD outlook on the H4 chart.
Disclaimer: The analysis provided for USD/CAD is for informational purposes only and does not constitute investment advice. Traders are encouraged to perform their own analysis and research before making any trading decisions on USDCAD. Market conditions can change quickly, so staying informed with the latest data is essential.