Time Zone: GMT +3
Time Frame: 4 Hours (H4)
Fundamental Analysis:
The XAUUSD pair is poised for potential volatility today due to significant news releases related to the US Dollar. Several Federal Reserve officials, including Christopher Waller, Beth Hammack, Alberto Musalem, and John Williams, are scheduled to speak at various conferences and events. Hawkish remarks from these FOMC members regarding future interest rate hikes could strengthen the USD, placing downward pressure on gold prices. Additionally, the release of Pending Home Sales data could further influence USD strength depending on actual versus forecasted figures, impacting GOLD/USD price action.
Price Action:
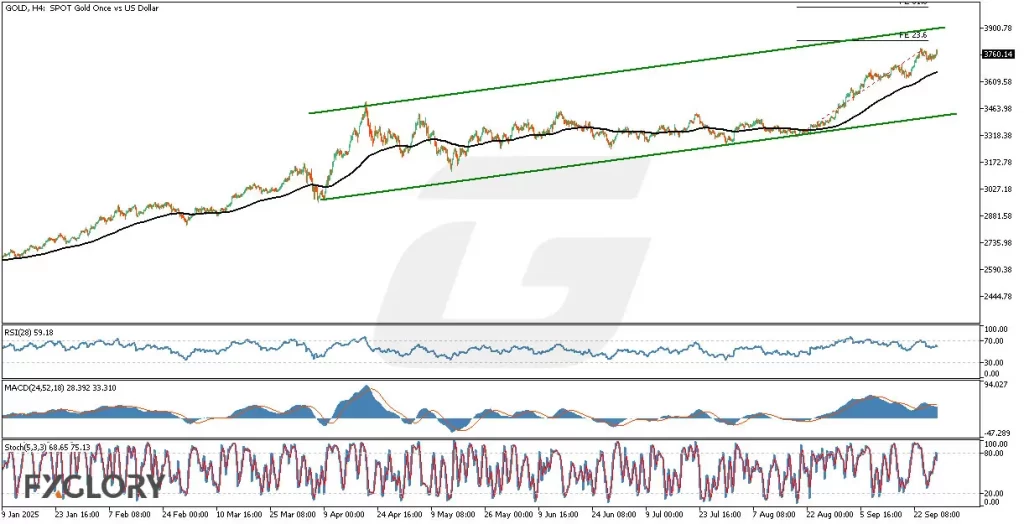
Analyzing GOLD in the H4 timeframe reveals a clear ascending channel, with the price approaching the upper boundary of this channel. The price has currently breached the Fibonacci 23.6% retracement level, and bullish momentum could potentially drive it towards the Fibonacci 50% and 61.8% levels. Price remains above the 100-period moving average, indicating sustained bullish strength, though caution is warranted near channel resistance.
Key Technical Indicators:
Moving Average (100): The price remains well above the 100-period moving average, emphasizing bullish sentiment. As long as this dynamic support holds, further upward momentum is possible.
RSI (28): The Relative Strength Index currently stands at 59.18, signaling moderate bullish momentum with room for further upside before reaching overbought conditions. Traders should watch RSI for signs of overextension near channel resistance.
MACD (24,52,18): The MACD line at 28.392 remains below the signal line at 33.310 but shows diminishing bearish divergence. This suggests a cautious bullish outlook as momentum gradually strengthens, though traders should monitor closely for any potential bearish crossovers.
Stochastic (5,3,3): The Stochastic oscillator at 68.65 and 75.13 is nearing the overbought threshold at 80, indicating that upward momentum could soon face resistance. A crossover above the 80-level would signal increased caution for a possible price correction.
Support and Resistance:
Support: Immediate support levels are identified at 3690.00 (100-period moving average), followed by 3640.00 (lower boundary of the ascending channel and recent consolidation).
Resistance: Key resistance is observed at the channel’s upper boundary near 3765.00 (Fibonacci 23.6%), with further levels at Fibonacci 50% and 61.8%, around 3820.00 and 3870.00, respectively.
Conclusion and Consideration:
Technical indicators and current price action suggest continued bullish momentum for XAU/USD on the H4 timeframe. However, given the proximity to critical resistance levels and upcoming USD-related news, traders should anticipate heightened volatility. Careful monitoring of the RSI, MACD, and Stochastic indicators is essential to identify early signs of reversal or continuation. Traders are advised to stay cautious and consider setting tight stop-losses due to potential sharp market reactions following Federal Reserve speakers’ remarks and economic data releases.
Disclaimer: The analysis provided for XAU/USD is for informational purposes only and does not constitute investment advice. Traders are encouraged to perform their own analysis and research before making any trading decisions on XAUUSD. Market conditions can change quickly, so staying informed with the latest data is essential.