Time Zone: GMT +3
Time Frame: 4 Hours (H4)
Fundamental Analysis:
The BTC/USD currency pair is currently influenced by substantial economic data releases and events from the U.S., which may significantly impact market volatility. Today, various Federal Reserve officials, including Austan Goolsbee, Jeffrey Schmid, John Williams, Michelle Bowman, Michael Barr, Lorie Logan, and Mary Daly, are scheduled to speak. Their remarks regarding future monetary policy and economic outlook could affect the strength of the USD and, consequently, the BTC/USD pair. Key economic indicators including GDP, Jobless Claims, Durable Goods Orders, and Trade Balance will provide traders with essential insights into the overall health of the U.S. economy and currency strength.
Price Action:
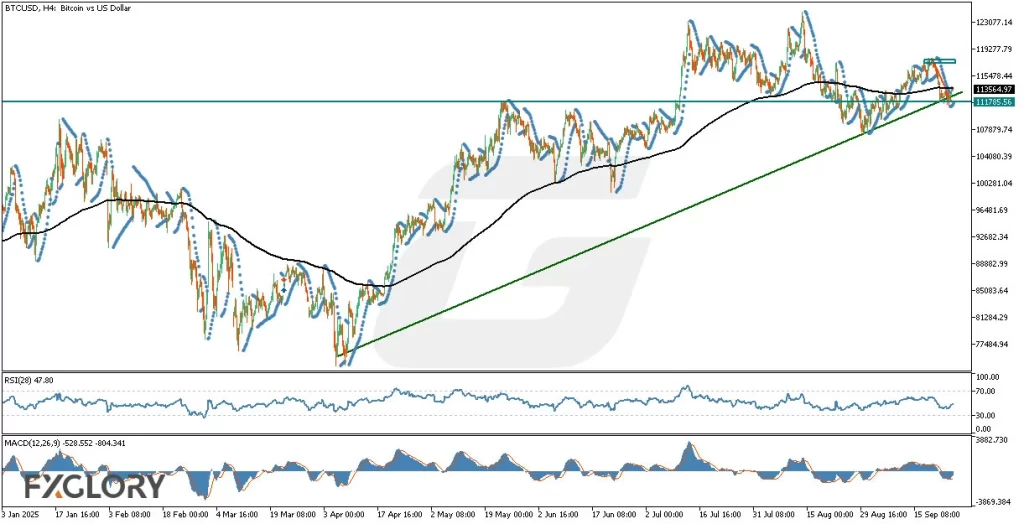
BTC-USD pair analysis on the H4 chart indicates a clear upward trend. Recently, BTCUSD reached a crucial support zone around 111,790, coinciding closely with an established ascending trend line. The price has successfully broken through the resistance line of the recent correction, suggesting a continuation of the bullish trend. Current price action indicates potential further upside, targeting the 117,600 level.
Key Technical Indicators:
EMA (240): The price is currently struggling around the EMA (240), serving as a dynamic resistance level. A confirmed break and close above this EMA could strengthen bullish sentiment.
RSI (28): Currently, the RSI is at 47.80, reflecting a neutral momentum environment. This indicates sufficient room for price appreciation before reaching overbought conditions, thus supporting potential upward movement.
MACD (12,26,9): The MACD histogram exhibits weakening bearish momentum, suggesting the possibility of an imminent bullish crossover. This potential shift signals increasing bullish pressure in the near term.
Parabolic SAR: Recent dots of the Parabolic SAR indicator are placed beneath the price candles, reaffirming the bullish sentiment and indicating a bullish trend continuation.
Support and Resistance:
Support: Immediate and critical support lies around the 111,790 area, which aligns with the established ascending trend line.
Resistance: The primary resistance level to watch is at 117,600, representing the next key target for the ongoing bullish momentum.
Conclusion and Consideration:
BTC/USD on the H4 chart maintains a bullish outlook, supported by successful trendline testing and encouraging signals from technical indicators including EMA, RSI, MACD, and Parabolic SAR. Market participants should carefully monitor today’s key U.S. economic events and Federal Reserve speeches, as any unexpected commentary or data could induce significant volatility and potentially influence short-term price action. Traders are advised to implement appropriate risk management strategies considering potential market fluctuations due to economic news.
Disclaimer: The analysis provided for BTC/USD is for informational purposes only and does not constitute investment advice. Traders are encouraged to perform their own analysis and research before making any trading decisions on BTCUSD. Market conditions can change quickly, so staying informed with the latest data is essential.


