Time Zone: GMT +3
Time Frame: 4 Hours (H4)
Fundamental Analysis:
The EURGBP currency pair reflects the exchange rate between the Euro (EUR) and the British Pound (GBP). Today, the Euro is expected to face notable volatility with ECB President Christine Lagarde delivering opening remarks at the 10th Annual ECB Research Conference, alongside a speech from Bundesbank President Joachim Nagel. Both events could provide forward guidance on Eurozone monetary policy. Additionally, CPI data for the Eurozone remains a crucial focus as inflation pressures continue to influence ECB rate expectations. On the UK side, attention is on inflation-linked releases such as the Consumer Price Index (CPI), Core CPI, Retail Price Index (RPI), and Housing Price Index (HPI), all of which will provide important insights into the Bank of England’s policy path. Traders should anticipate sharp price movements in EURGBP due to overlapping high-impact events from both economies.
Price Action:
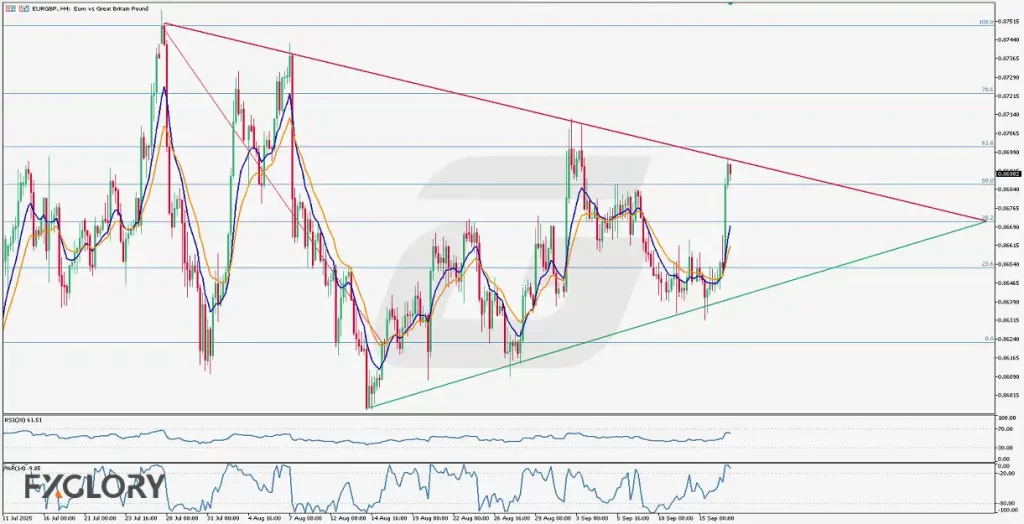
The EUR/GBP H4 chart shows that the pair has been consolidating within a large symmetrical triangle pattern for nearly two months, with multiple tests of both bullish and bearish long-term trendlines. Recently, the price surged with two strong bullish candles but reversed into a red candle after touching the long-term descending bearish trendline between the 50.0% and 61.8% Fibonacci retracement levels, halting further bullish extension. This highlights the significance of the triangle structure as a battle zone between bulls and bears. The price has tested both trendlines at least three times without a breakout, and the apex of the triangle aligns near the 38.2% Fibonacci level, suggesting a decisive breakout may occur soon.
Key Technical Indicators:
Moving Averages (MA 9 and MA 17): The short-term moving average (MA 9 – blue) has crossed above the long-term moving average (MA 17 – orange), signaling short-term bullish momentum. Both averages are sloping upward, supporting the possibility of continued bullish attempts unless rejected strongly at resistance.
Relative Strength Index (RSI): The RSI is currently at 61.51, leaning toward bullish territory but not yet overbought. This indicates that while momentum is on the upside, the pair still has room for further gains before hitting extreme levels.
Williams %R (14): The Williams %R indicator stands at -9.85, placing it in overbought territory. This suggests that despite bullish momentum, a near-term pullback or consolidation is likely as the market has already priced in strong buying pressure.
Support and Resistance:
Support: Strong support lies at 0.8654, where the bullish trendline and the 23.6% Fibonacci level converge, offering a solid base for buyers.
Resistance: Key resistance is positioned at 0.8696, corresponding to the long-term descending bearish trendline and just below the 61.8% Fibonacci retracement.
Conclusion and Consideration:
The EUR-GBP H4 technical analysis highlights a pair locked within a tightening triangle structure, with both bulls and bears defending critical Fibonacci levels. Short-term indicators such as the MA crossover support bullish continuation, while the Williams %R warns of possible consolidation or correction. Given today’s high-impact ECB speeches and Eurozone CPI outlook, as well as upcoming UK inflation figures, traders should remain cautious for breakout opportunities near the triangle apex around 38.2% Fib. The price action suggests that whichever side breaks first will likely define the medium-term trend for EUR GBP.
Disclaimer: The analysis provided for EUR/GBP is for informational purposes only and does not constitute investment advice. Traders are encouraged to perform their own analysis and research before making any trading decisions on EURGBP. Market conditions can change quickly, so staying informed with the latest data is essential.