Time Zone: GMT +3
Time Frame: 4 Hours (H4)
Fundamental Analysis
The BTC-USD pair today is influenced primarily by economic news from the United States. Today’s USD news features New Residential Sales data, a significant indicator of economic health. Stronger-than-expected sales could strengthen the USD, putting downward pressure on BTCUSD. Furthermore, Federal Reserve Bank of Dallas President Lorie Logan will speak at the Bank of Mexico Centennial Conference. Traders should closely monitor this event for indications of future monetary policy, which could lead to heightened market volatility and influence the BTCUSD price action.
Price Action
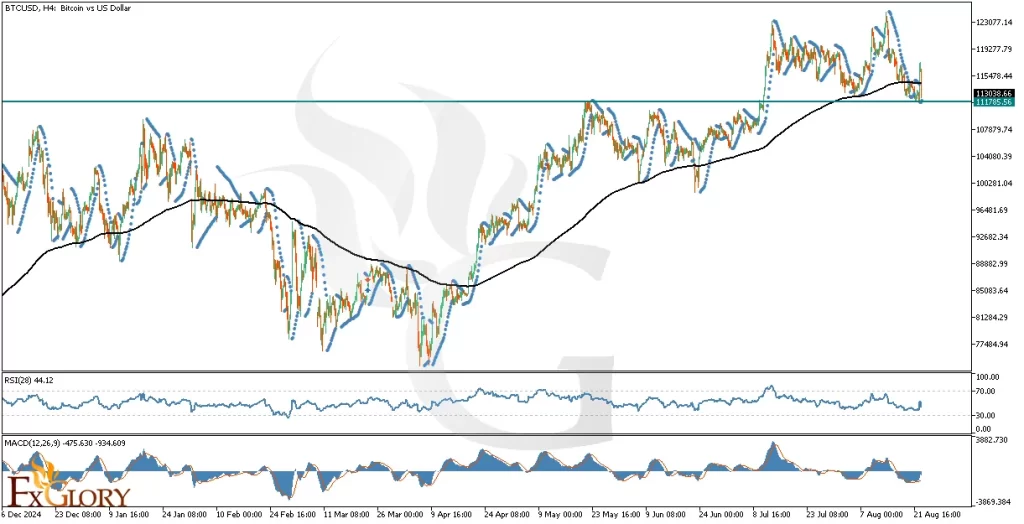
Analyzing the BTCUSD H4 chart reveals the formation of a classic double-top pattern around the significant resistance level at approximately 112000. Price tested this resistance twice but failed to sustain higher, confirming bearish momentum. A divergence is clearly visible in RSI, indicating a weakening of the previous bullish trend. Notably, BTCUSD has recently broken the long-term EMA from below, signaling a potential bearish reversal.
Key Technical Indicators
EMA (240): The long-term EMA has been decisively breached from below, highlighting a bearish sentiment shift. This break suggests traders could be positioning for potential downward movements.
Parabolic SAR: Recent Parabolic SAR dots appear below the BTCUSD price, typically indicating short-term bullishness. However, given other bearish signals, caution is warranted.
RSI (28): Currently at 44.12 and moving upwards towards the neutral 50 level. While this could imply a short-term recovery, the prior divergence points toward possible continued bearish pressure.
MACD (12,26,9): The MACD line is significantly below the signal line at -475.63 versus -934.609, indicating strong bearish momentum. Traders should monitor this closely for signs of weakening downward momentum or possible reversal signals.
Support and Resistance
Support: Immediate support is established around 107800, a recent swing low. A breakdown below this level could trigger a further bearish move towards the psychological support level at 105000.
Resistance: Key resistance is clearly defined at around the 112000 level, coinciding with the double-top formation. Surpassing this level would negate the bearish pattern and potentially renew bullish momentum.
Conclusion and Consideration
The BTC/USD H4 analysis suggests increasing bearish pressure reinforced by technical signals like the double-top formation, RSI divergence, and EMA breakdown. While short-term bullish indications are present via Parabolic SAR, the overall technical picture supports bearish sentiment. Upcoming USD events could further exacerbate volatility; thus, traders should maintain caution and consider strict risk management practices.
Disclaimer: The analysis provided for BTC/USD is for informational purposes only and does not constitute investment advice. Traders are encouraged to perform their own analysis and research before making any trading decisions on BTCUSD. Market conditions can change quickly, so staying informed with the latest data is essential.