Time Zone: GMT +3
Time Frame: 4 Hours (H4)
Fundamental Analysis:
The gold market is currently influenced by ongoing USD strength expectations, driven by scheduled speeches from key Federal Reserve officials including Jerome Powell, Susan Collins, and Beth Hammack. Hawkish statements on monetary policy and economic outlook from these FOMC members could support USD appreciation, placing downward pressure on gold prices in the short term. Moreover, global inflation concerns and safe-haven demand for gold continue to influence the XAU/USD market, making it sensitive to both USD fluctuations and geopolitical risks. Traders should closely monitor these speeches for indications of interest rate changes that may impact gold’s price action on H4 and daily charts.
Price Action:
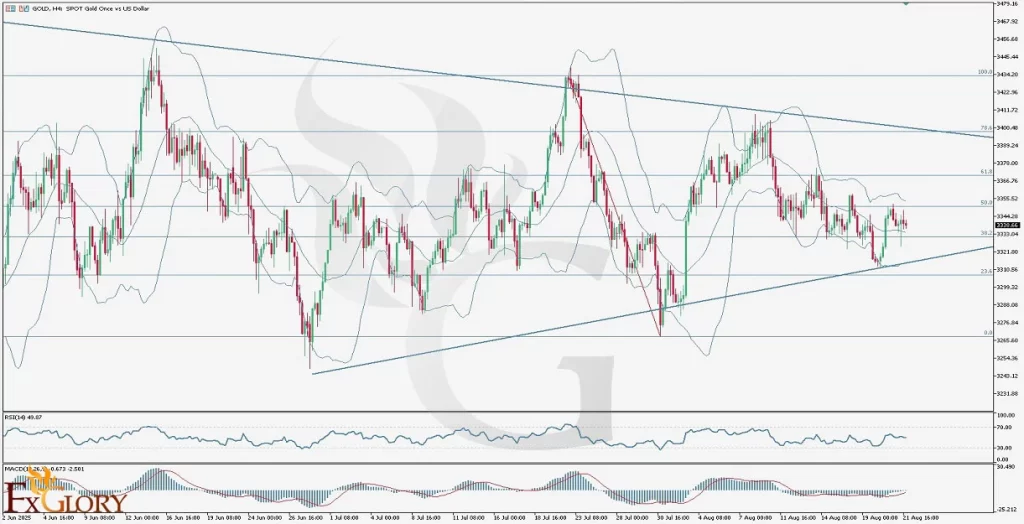
On the H4 chart, gold is showing a short-term bearish trend after testing the upper Bollinger Band and the 50% Fibonacci retracement level, which acted as strong resistance. The price has since moved toward the middle Bollinger Band and the 38.2% Fibonacci retracement level, indicating consolidation within the current range. The market is forming a symmetrical triangle pattern, with higher lows and lower highs, suggesting that a breakout from these trendlines could define the next directional move. Currently, gold is reacting to established support and resistance levels, and traders should observe whether the upper or lower trendline breaks.
Key Technical Indicators:
Bollinger Bands: Gold’s price recently reached the upper Bollinger Band and retraced toward the middle band, signaling short-term bearish momentum. The bands are moderately wide, indicating average volatility in the H4 timeframe. The price respecting both the upper and middle bands confirms the relevance of these levels in guiding intraday trades.
MACD (Moving Average Convergence Divergence): The MACD line is at -0.673 and the signal line at -2.501, indicating bearish momentum in the short term. The histogram suggests a slight recovery but the overall trend remains negative, supporting a cautious approach for potential short trades.
RSI (Relative Strength Index): The RSI is currently at 49.87, moving horizontally near the neutral zone. This indicates neither overbought nor oversold conditions, suggesting the market is consolidating and could respond sharply once a breakout from the triangle pattern occurs.
Support and Resistance:
Support: Immediate support is near 3333.00, aligning with the 38.2% Fibonacci retracement level, with secondary support around 3330.00, marking a key area of prior consolidation.
Resistance: The nearest resistance zone is between 3350.00 and 3355.00, coinciding with the 50% Fibonacci retracement level and the upper Bollinger Band, providing strong potential selling pressure.
Conclusion and Consideration:
Gold on the H4 chart is currently in a consolidation phase within a symmetrical triangle pattern. Short-term bearish momentum is observed, supported by the retracement from the upper Bollinger Band and MACD readings. Traders should watch key trendline breaks and upcoming USD-related news for directional confirmation. A break above 3355 could signal bullish momentum, while a drop below 3320 could accelerate the bearish trend. Market participants must remain cautious given the high volatility potential from upcoming speeches by Federal Reserve officials.
Disclaimer: The analysis provided for GOLD/USD is for informational purposes only and does not constitute investment advice. Traders are encouraged to perform their own analysis and research before making any trading decisions on GOLDUSD. Market conditions can change quickly, so staying informed with the latest data is essential.