Time Zone: GMT +3
Time Frame: 4 Hours (H4)
Fundamental Analysis:
The USD/JPY currency pair is currently influenced by a packed economic calendar for both the United States and Japan. For the JPY, traders are watching today’s GDP Deflator, Real GDP, and Industrial Production data from the Cabinet Office and METI. Stronger-than-expected Japanese growth or production figures may bolster the Yen by raising the prospect of tighter Bank of Japan policy. On the USD side, key data releases include Retail Sales, Core Retail Sales, Empire State Manufacturing Index, Import Price Index, Capacity Utilization, Industrial Production, and University of Michigan Consumer Sentiment. Positive results across these indicators would strengthen the USD by supporting a hawkish Federal Reserve stance, while weaker outcomes could dampen dollar demand. Given the heavy data flow, volatility in USDJPY is likely to remain elevated throughout the session.
Price Action:
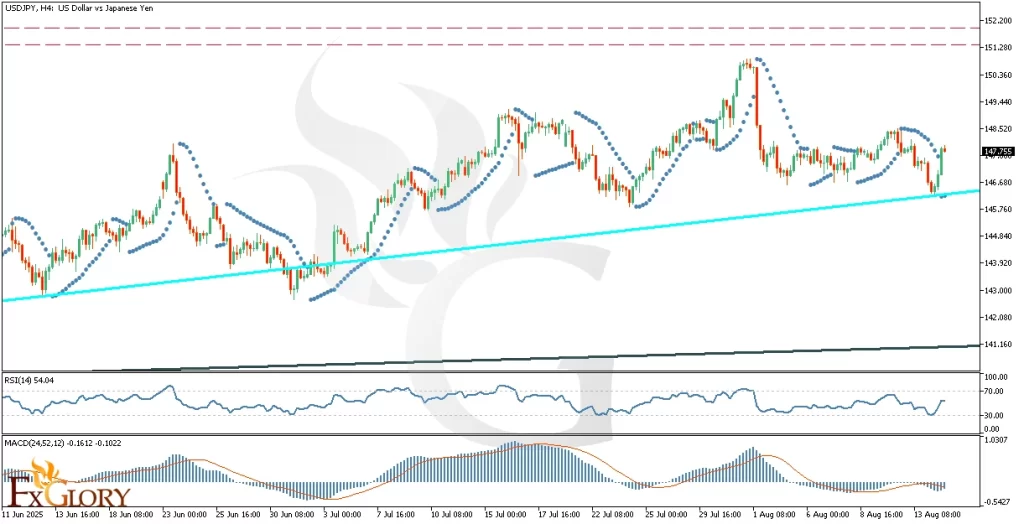
On the H4 timeframe, USD-JPY has been trending upward since mid-June 2025, respecting a strong ascending trendline. The pair recently tested this dynamic support at 146.70 and bounced higher, signaling renewed bullish pressure. This rebound keeps the sequence of higher highs and higher lows intact, pointing toward a possible move toward 151.60 in the medium term. The recent pullback appears corrective in nature, and the recovery suggests bullish continuation remains the dominant scenario.
Key Technical Indicators:
Parabolic SAR: The most recent Parabolic SAR dots have flipped above the price and are widening, indicating that the prior bearish momentum is losing steam and that a bullish reversal is taking shape as the market reclaims the trendline.
RSI (14): Currently at 54.04, the RSI has broken above the neutral 50 level from below, reflecting improving bullish momentum. This position still leaves room before reaching the overbought threshold (70), which supports the potential for further upside.
MACD (24,52,12): The MACD line at -0.1612 and the signal line at -0.1022 remain in negative territory but are converging. This narrowing gap suggests weakening bearish momentum, and a bullish crossover could confirm the next leg higher toward the 151.60 resistance.
Support and Resistance:
Support: Immediate support is located at 146.700, which aligns with the ascending trendline and a recent price rebound zone. A deeper correction could find the next support at 145.750, matching a previous consolidation area.
Resistance: The nearest resistance level is at 149.450, which coincides with the last swing high before the recent retracement. A sustained breakout above this level could open the way toward 151.600, a key long-term resistance zone and previous peak.
Conclusion and Consideration:
The USDJPY H4 chart remains structurally bullish, with price respecting the ascending trendline and indicators signaling potential momentum recovery. RSI’s move above 50, the Parabolic SAR shift, and MACD’s potential bullish crossover all align with the possibility of an advance toward 149.45 and, if broken, the 151.60 resistance. However, today’s multiple high-impact data releases from both the US and Japan could trigger sharp intraday swings. Traders should manage positions carefully and consider volatility when setting stop-loss and take-profit levels.
Disclaimer: The analysis provided for USD/JPY is for informational purposes only and does not constitute investment advice. Traders are encouraged to perform their own analysis and research before making any trading decisions on USDJPY. Market conditions can change quickly, so staying informed with the latest data is essential.


