Time Zone: GMT +3
Time Frame: 4 Hours (H4)
Fundamental Analysis:
The GBP-USD currency pair is currently driven by anticipation of key economic data from both the UK and the US. For the Pound, traders are awaiting the RICS Housing Price Balance, a leading indicator of housing market trends, which could influence GBP sentiment if it beats or misses expectations. Later this week, UK GDP, Trade Balance, Industrial Production, and Manufacturing Production will be released, all of which could shape medium-term price direction. On the US side, the focus is on PPI inflation data and weekly jobless claims. Hawkish FOMC commentary could lift the USD, while softer data may encourage further GBP strength. Given the economic calendar, volatility in GBPUSD is expected to rise.
Price Action:
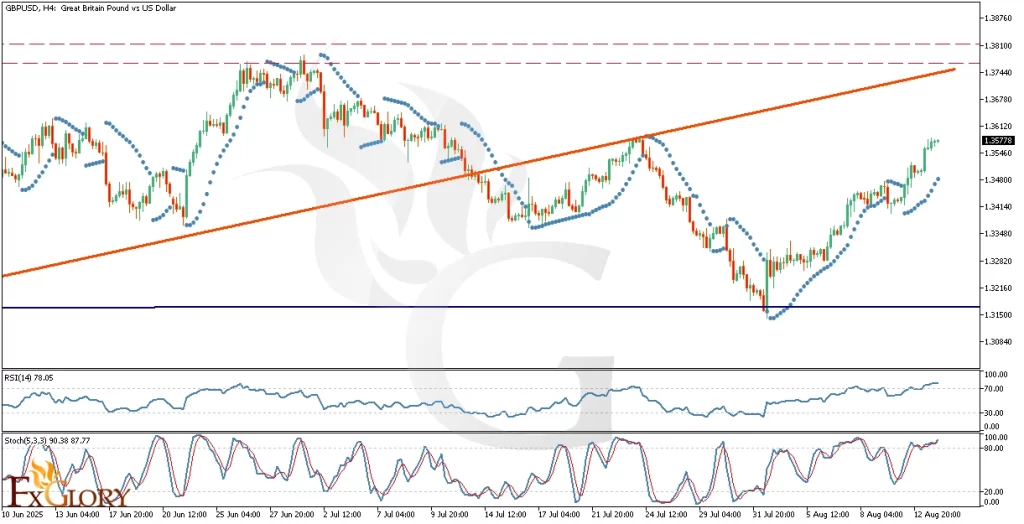
The GBP/USD H4 chart shows a strong rebound from the broken support level at 1.31726, with price action trending higher toward the long-term uptrend line. If buyers succeed in breaking above this trendline, the next target is the 1.37820 resistance level. The Parabolic SAR remains firmly bullish, showing widening gaps below the price, which indicates accelerating buying pressure. However, with momentum oscillators in extreme overbought conditions, there is potential for a short-term pause before the next rally attempt.
Key Technical Indicators:
Parabolic SAR: The dots are positioned below the current price and the gap between the dots and the candles has widened. This indicates that the bullish momentum is strengthening, supporting the possibility of further upside if resistance levels are broken.
RSI (Relative Strength Index): The RSI is at 78.05, above the overbought threshold of 70. While this highlights strong bullish momentum, it also signals that the market could be overextended, increasing the likelihood of a pullback or consolidation.
Stochastic Oscillator (5,3,3): The %K and %D readings are at 90.38 and 87.77, respectively, confirming extreme overbought conditions. This aligns with RSI warnings and suggests that while buyers are in control, short-term corrective moves cannot be ruled out.
Support and Resistance:
Support: Immediate support is at 1.31726, which was previously a resistance zone and aligns with a recent price breakout area.
Resistance: The nearest resistance is at 1.37820, which coincides with a key swing high and projected upside target if the uptrend line breaks.
Conclusion and Consideration:
The GBPUSD H4 analysis suggests sustained bullish momentum, backed by strong price action and supportive technical indicators. However, with both RSI and Stochastic in overbought territory, the probability of short-term consolidation or retracement before testing 1.37820 is high. Traders should monitor today’s UK housing data and US inflation numbers closely, as these releases could be the catalysts for either a breakout continuation or a pullback toward support.
Disclaimer: The analysis provided for GBP/USD is for informational purposes only and does not constitute investment advice. Traders are encouraged to perform their own analysis and research before making any trading decisions on GBPUSD. Market conditions can change quickly, so staying informed with the latest data is essential.