Time Zone: GMT +3
Time Frame: 4 Hours (H4)
Fundamental Analysis:
The AUD-USD currency pair is currently influenced by mixed signals from both the Australian and US economic fronts. Today’s key upcoming AUD-related releases include the National Australia Bank (NAB) Business Confidence report, a leading indicator of business sentiment that can foreshadow future economic activity such as hiring and investment. Additionally, traders are awaiting further clarity from the Reserve Bank of Australia (RBA) regarding its interest rate outlook ahead of the September 30 meeting. From the US side, market focus will shift to the NFIB Small Business Index and later this week, the Consumer Price Index (CPI), which remains a major driver for Federal Reserve rate expectations. Speeches from Fed officials Thomas Barkin and Jeffrey Schmid could add volatility to USD pairs as traders seek clues on the next monetary policy steps.
Price Action:
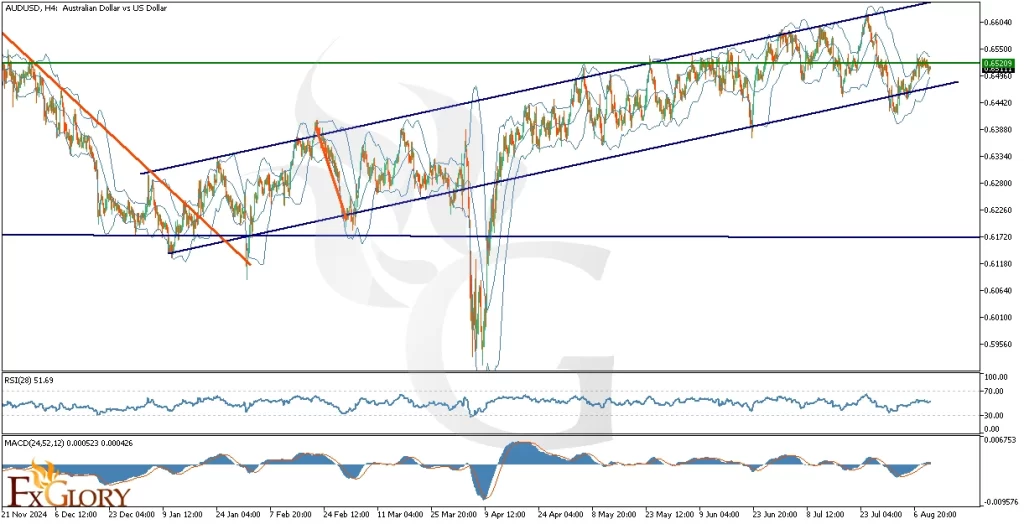
On the H4 chart, AUD USD has been trading within a long-term ascending trend channel following a recovery from its March low. Price is now locked in a sideways daily range within this upward channel, with the current battle occurring around the mid-line of the daily channel. The pair is showing hesitation, with momentum not strong enough to convincingly break above the mid-range resistance. If the bulls fail to secure this breakout, a retracement toward the lower trendline of the channel—and potentially the lower boundary of the sideways range—is likely. Conversely, a successful breakout could open the path toward the upper band of the daily range.
Key Technical Indicators:
Bollinger Bands: The Bollinger Bands are narrowing, signaling a potential volatility squeeze. The price is currently testing the middle line of the Bands, which aligns with the mid-range resistance of the sideways channel. This compression suggests that a breakout move—either up or down—may occur soon, but given the weaker bullish momentum, the downside risk appears slightly higher.
RSI (28): The Relative Strength Index is at 51.69, reflecting a neutral momentum state. This position shows neither overbought nor oversold conditions, which supports the case for potential range-bound trading in the near term. The RSI does not currently show strong bullish divergence, reinforcing the risk of a corrective move.
MACD (24,52,12): The MACD main line (0.000523) is marginally above the signal line (0.000426), and the histogram has recently crossed above the zero line. While this suggests a mild bullish bias, the histogram’s low amplitude indicates that momentum is still weak and susceptible to reversal. A bearish crossover here could accelerate a drop toward support.
Support and Resistance:
Support: Immediate support is located at 0.6440, which aligns with the lower boundary of the short-term ascending channel and recent price consolidation area.
Resistance: The nearest resistance level is at 0.6529, which coincides with the mid-line of the sideways daily channel and recent highs.
Conclusion and Consideration:
The AUD/USD H4 chart shows a market at a critical juncture, trading at the mid-line resistance of a sideways daily channel within an ascending trend structure. While the narrowing Bollinger Bands point toward an upcoming breakout, the combination of a neutral RSI and a weak MACD histogram suggests the upside lacks conviction. This makes a downward correction toward 0.6440 more probable unless strong bullish momentum emerges. Traders should closely monitor today’s NAB Business Confidence report and speeches from US Fed officials for potential catalysts.
Disclaimer: The analysis provided for AUD/USD is for informational purposes only and does not constitute investment advice. Traders are encouraged to perform their own analysis and research before making any trading decisions on AUDUSD. Market conditions can change quickly, so staying informed with the latest data is essential.