Time Zone: GMT +3
Time Frame: 4 Hours (H4)
Fundamental Analysis:
Gold prices (XAU/USD) today could experience increased volatility due to important upcoming USD news releases. The Census Bureau will release data on U.S. Factory Orders, a key indicator measuring the total value of new purchase orders placed with manufacturers. An actual value greater than forecasted typically strengthens the USD, putting downward pressure on gold prices. Additionally, insights from the Federal Reserve’s quarterly lending report, indicating confidence in lending and spending, could impact USD strength. Traders should closely monitor these releases, as stronger-than-expected data may weigh on gold prices, while weaker data could provide support.
Price Action:
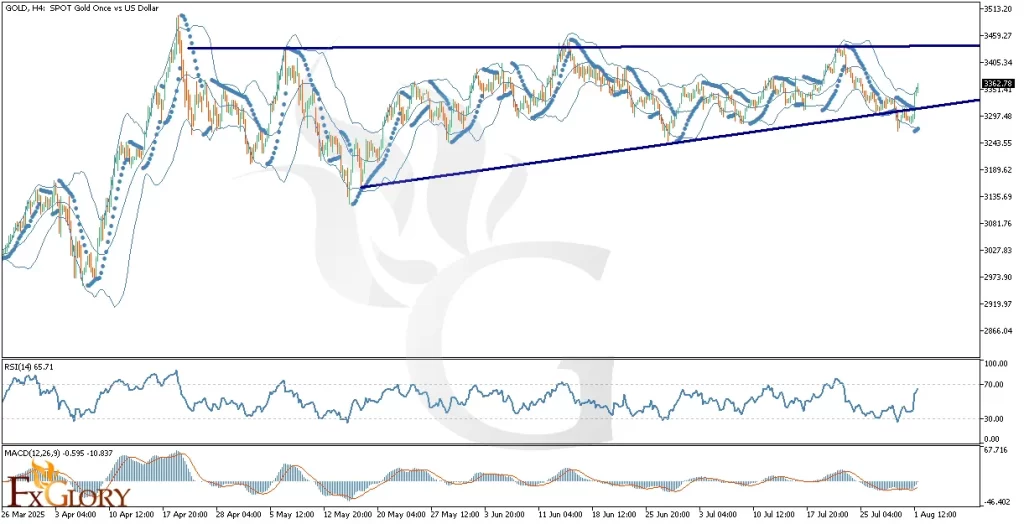
The GOLDUSD H4 chart indicates a clear ascending triangle pattern, following a strong bullish uptrend. Recently, price action has respected the triangle’s bottom trendline and is currently moving toward the upper boundary. The presence of strong bullish engulfing candles and positive market momentum suggests a greater probability of an upward breakout, potentially extending the bullish trend.
Key Technical Indicators:
Parabolic SAR: On the H4 timeframe, Parabolic SAR dots are situated below the price, indicating a bullish momentum and supporting the likelihood of upward movement.
Bollinger Bands: Bollinger Bands are widening, indicating increased volatility. The current price has surpassed the upper band, signaling strong bullish momentum. Traders should be cautious of short-term pullbacks, but overall conditions favor continued bullish action.
RSI (Relative Strength Index): The RSI stands at 65.71, suggesting bullish strength but still below the overbought threshold of 70. This indicates that gold prices (XAU/USD) have room to continue rising before becoming overextended.
MACD (Moving Average Convergence Divergence): The MACD line currently reads -0.595, with the signal line at -10.837, indicating an emerging bullish crossover. Although still negative, upward momentum is strengthening, suggesting a continuation of bullish pressure.
Support and Resistance:
Support: Immediate support is identified at approximately 3297.50, aligning with the ascending triangle’s bottom line and recent price consolidation.
Resistance: Immediate resistance is located near the upper boundary of the ascending triangle, around 3459.00, representing recent highs and a significant psychological level.
Conclusion and Consideration:
The XAU/USD H4 technical analysis reveals a predominantly bullish outlook, supported by strong price action, bullish indicators such as the Parabolic SAR and Bollinger Bands, and increasing bullish momentum reflected by MACD and RSI. The ascending triangle pattern suggests a high probability of upward breakout. Traders should closely monitor today’s USD economic news, as data strength will significantly influence price volatility and momentum direction.
Disclaimer: The analysis provided for XAU/USD is for informational purposes only and does not constitute investment advice. Traders are encouraged to perform their own analysis and research before making any trading decisions on XAUUSD. Market conditions can change quickly, so staying informed with the latest data is essential.