Time Zone: GMT +3
Time Frame: 4 Hours (H4)
Fundamental Analysis:
Today, ETH/USD market participants should closely monitor two major economic events influencing volatility. The US and EU have finalized a trade deal, imposing a 15% US tariff on most EU exports, including critical sectors like automobiles, pharmaceuticals, and semiconductors. While lower than the initially proposed 30%, the continued 50% tariff on steel and aluminum may induce market caution. Additionally, significant attention is on the upcoming US-China tariff negotiations in Stockholm. A positive outcome from these talks could ease investor tensions and boost risk assets such as Ethereum, supporting further bullish sentiment for ETH-USD.
Price Action:
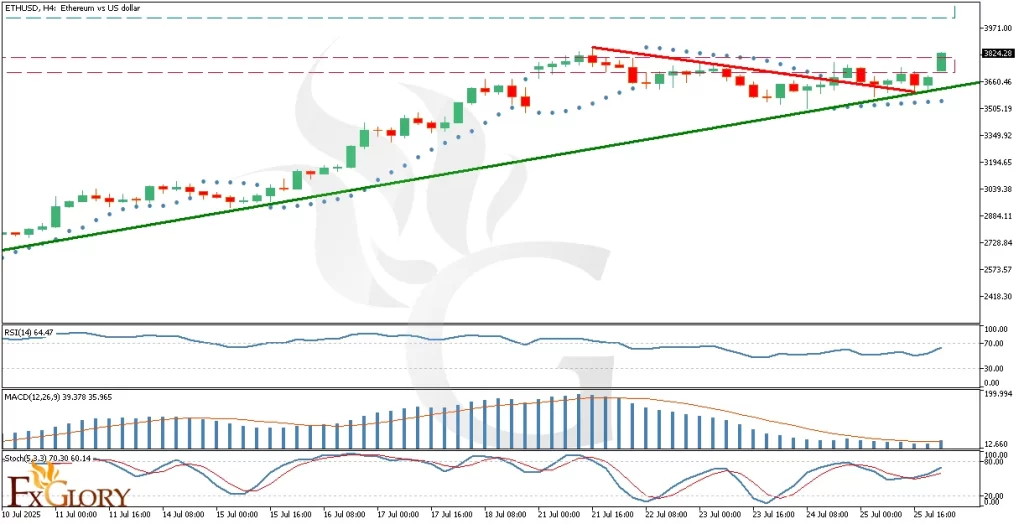
Technical analysis of ETH USD on the H4 timeframe shows a bullish momentum reasserting itself. After failing to break the crucial resistance level of 3825 initially, ETH/USD underwent an 8% price correction, finding strong buying pressure at the ascending support line. Currently, ETH-USD is again challenging the 3825 level with renewed strength, indicating strong bullish intent. Should the price decisively close above this key resistance, a further move toward the 4100 area is expected.
Key Technical Indicators:
Parabolic SAR: ETHUSD’s Parabolic SAR dots have shifted below the candlesticks, signaling a fresh bullish phase and suggesting that upward momentum will likely persist in the short term.
RSI (Relative Strength Index): The RSI currently hovers around the 64.47 level. There is clear bullish divergence signaling sustained buying interest and room for ETHUSD to extend gains without immediate risk of overbought conditions.
MACD (Moving Average Convergence Divergence): The MACD indicator registers positive values at approximately 39.378 and 35.965, with the MACD line above the signal line. This alignment underscores increasing bullish momentum, reinforcing the likelihood of price continuation upward.
Stochastic Oscillator: ETH-USD’s stochastic oscillator currently stands at approximately 70.30 and 60.14. This indicator further supports bullish momentum, although traders should remain vigilant for potential short-term pullbacks, particularly near resistance.
Support and Resistance:
Support: Immediate key support lies at 3600, reinforced by the ascending trendline.
Resistance: Critical immediate resistance is positioned at 3825, with further resistance projected around the psychological level of 4100.
Conclusion and Consideration:
ETHUSD’s H4 technical chart analysis strongly favors continued bullish price action, supported by bullish signals across the Parabolic SAR, RSI, MACD, and stochastic indicators. With supportive fundamental developments anticipated from US-China tariff negotiations and stabilized US-EU trade relations, ETH vs. USD has favorable conditions for breaking higher. However, traders must remain cautious near key resistance levels and closely watch upcoming economic news developments that may significantly influence market volatility.
Disclaimer: The analysis provided for ETH/USD is for informational purposes only and does not constitute investment advice. Traders are encouraged to perform their own analysis and research before making any trading decisions on ETHUSD. Market conditions can change quickly, so staying informed with the latest data is essential.