Time Zone: GMT +3
Time Frame: 4 Hours (H4)
Fundamental Analysis:
Today’s NZD/USD fundamental analysis for the H4 timeframe reveals a focus on key economic data releases that could significantly impact the currency pair. For the USD, we are awaiting crucial reports including Treasury International Capital (TIC) data, Building Permits, Housing Starts, and the University of Michigan Consumer Sentiment and Inflation Expectations. Additionally, a speech from Federal Reserve Governor Christopher Waller will be closely watched for any hawkish or dovish signals on monetary policy, which can drive forex market volatility. The G20 meeting, while not a direct market mover today, highlights ongoing global economic discussions that could influence sentiment. For the NZD, the Reserve Bank of New Zealand (RBNZ) credit card spending data will provide insights into consumer activity and confidence. These economic indicators and speeches are vital for NZDUSD trading strategies and can lead to price action shifts.
Price Action:
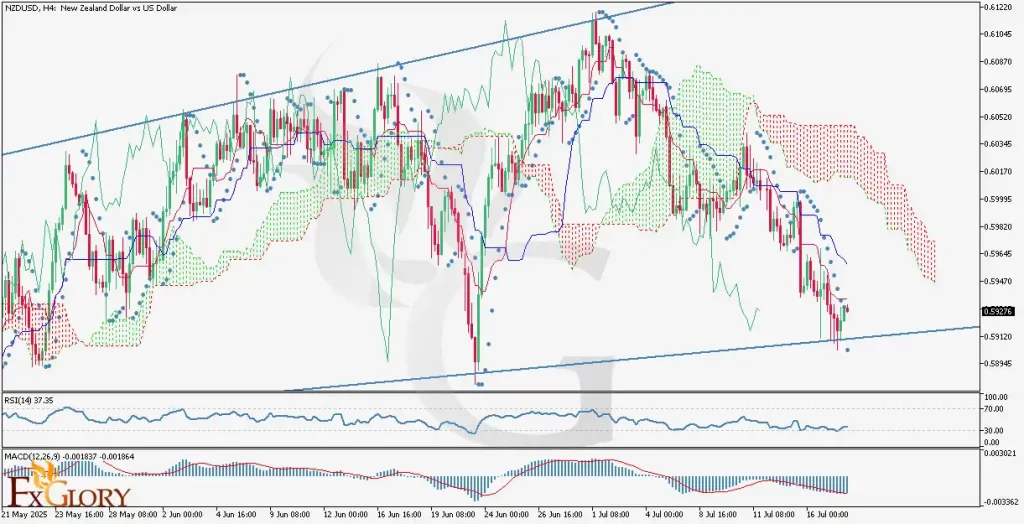
The NZD/USD price action on the H4 chart indicates that the price is moving in a slight bullish trend in the long term but has reached a significant long-term trend line, which has consistently acted as a strong support level. This support trend line has been tested twice before, and each time the NZD USD price failed to break below it, leading to sharp bullish reversals. Currently, the short-term downward trend is showing signs of exhaustion, with the latest candles turning green, suggesting a potential correction or reversal. This pattern suggests that the support level might hold again, potentially leading to another bullish bounce, similar to previous instances where the price rebounded strongly after touching this critical level.
Key Technical Indicators:
Ichimoku Cloud: The NZD-USD price is currently moving below the Ichimoku Cloud, which is trending downwards and has thinned out. This indicates a prevailing bearish sentiment in the short-term forex trend, although the thinning cloud might suggest a weakening of this bearish momentum or a potential for future price breakout or reversal if the price manages to cross above it.
Parabolic SAR (0.05 step, 0.2 maximum): The Parabolic SAR dots were initially placed above the candles, confirming the recent downtrend. However, the most recent dot has touched the last candle, and a new dot has now appeared below the candles. This Parabolic SAR signal is a strong indication of a potential NZD-USD trend reversal from bearish to bullish, suggesting upward momentum is building.
RSI (Relative Strength Index): The RSI line has touched the 30 level, indicating that the NZD-USD pair was in oversold territory. Following this, the RSI has changed direction and is now moving upward, signaling a potential bullish divergence and a recovery in buying pressure. This RSI analysis supports the idea that the current downward move might be losing steam, paving the way for a bullish correction.
MACD (Moving Average Convergence Divergence): The MACD (12,26,9) currently shows values of -0.001837 and -0.001864. While the indicator remains in bearish territory, the recent price action suggests decreasing downward momentum.
Support and Resistance:
Support: Immediate support for NZD/USD is identified at around 0.59050, coinciding with the long-term trend line that has historically acted as a strong floor.
Resistance: The nearest resistance level for NZD/USD is located at around 0.60160, which represents a key psychological and technical barrier for further upside movement.
Conclusion and Consideration:
The NZD/USD H4 chart analysis indicates a critical juncture where the long-term bullish trend line is being tested after a short-term bearish correction. While the Ichimoku Cloud and Parabolic SAR initially suggested bearishness, the recent price action, particularly the bounce from the support line, the Parabolic SAR flip, and the upward turn of the RSI from oversold levels, strongly hint at an impending bullish correction or reversal. Traders should pay close attention to the upcoming USD and NZD economic news today, as these releases have the potential to introduce significant volatility and could either reinforce or invalidate the observed technical analysis signals. The combination of technical and fundamental factors suggests a cautious approach, with a readiness to capitalize on a potential bullish rebound from the 0.59050 support level, targeting the 0.60160 resistance.
Disclaimer: The analysis provided for NZD/USD is for informational purposes only and does not constitute investment advice. Traders are encouraged to perform their own analysis and research before making any trading decisions on NZDUSD. Market conditions can change quickly, so staying informed with the latest data is essential.


