Time Zone: GMT +3
Time Frame: 4 Hours (H4)
Fundamental Analysis:
The EURGBP currency pair stands at a crucial juncture amid notable economic updates from both the Eurozone and the UK. For the British Pound, traders are closely monitoring comments from BOE Governor Andrew Bailey at the Annual Mansion House Financial and Professional Services Dinner, which could provide hints on future monetary policy direction and interest rate adjustments. Additionally, the British Retail Consortium’s retail sales data remains influential, with stronger-than-expected figures likely to support the GBP. On the Euro side, the ZEW Economic Sentiment Index for both Germany and the wider Eurozone, along with upcoming Industrial Production data, will shape market expectations about the Eurozone’s economic trajectory. Positive surprises from these indicators could bolster the EUR, influencing the EURGBP price action this week.
Price Action:
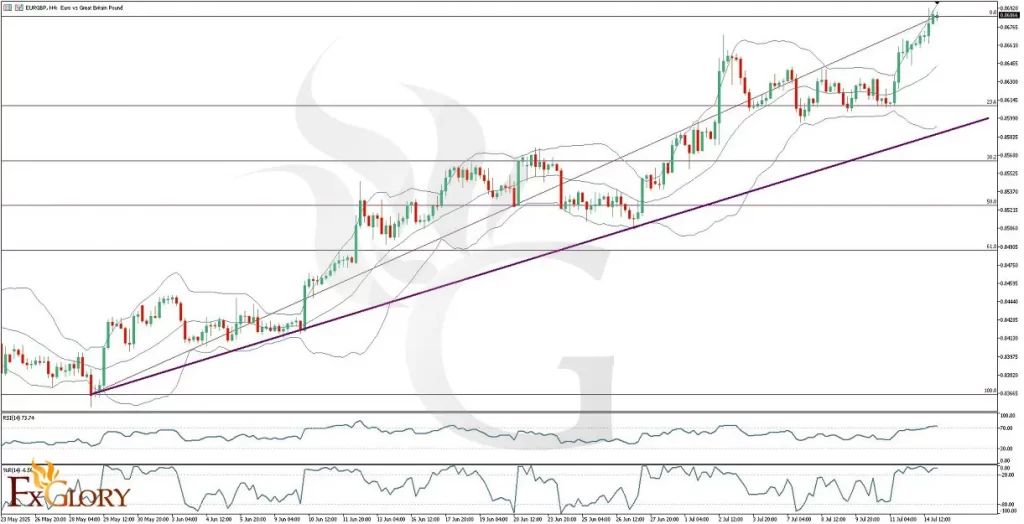
The EURGBP H4 chart demonstrates a strong bullish trend that has been in place since late May. Price action shows a series of higher highs and higher lows, supported by a robust ascending trendline. Over recent sessions, candles have moved significantly above this trendline, highlighting persistent buyer strength. While the bullish momentum is intact, the sharp ascent suggests the pair might soon face a correction, potentially revisiting lower Fibonacci retracement levels before resuming its upward path. Overall, the EURGBP technical outlook suggests the bullish scenario remains favored unless price decisively breaks below key support.
Key Technical Indicators:
Bollinger Bands: The bands are noticeably widening, reflecting heightened volatility and sustained bullish momentum in EURGBP H4. However, as the price hugs the upper band, it signals the market may soon exhaust its immediate upward drive, and a contraction of the bands could follow, ushering in a short-term correction phase.
RSI (Relative Strength Index): The RSI is positioned near the 70.00 level, indicating that the EURGBP pair is approaching overbought conditions on the H4 chart. While this supports the strength of the prevailing bullish trend, it also warns of a possible pullback or consolidation as traders start locking in profits.
Williams %R: The Williams %R oscillator is hovering between 0.00 and -20.00, which corroborates an overbought market environment. This aligns with the RSI reading and suggests that although the bulls are firmly in control, the pair is susceptible to a near-term pause or retracement toward support levels.
Support and Resistance:
Support: The nearest robust support lies around the Fibonacci 23.6% level, aligning close to 0.86100. A deeper correction could see the price move toward the 38.2% Fibonacci zone around 0.85600.
Resistance: Immediate resistance sits near 0.87000; a break above could lead to multi-week highs, with the next key level around 0.87200 (previously tested in past price action.)
Conclusion and Consideration:
In conclusion, the EURGBP H4 technical and fundamental chart analysis points toward a prevailing bullish momentum with potential for further upside, although short-term indicators warn of an overextended market that may soon enter a correction phase. Traders should stay vigilant for any dovish or hawkish surprises from BOE Governor Bailey’s speech or Eurozone ZEW sentiment results, which could trigger volatility and influence the next leg of EURGBP price action. It is prudent to monitor these levels closely, alongside the EURGBP technical indicators, for any signals of trend continuation or reversal.
Disclaimer: The analysis provided for EUR/GBP is for informational purposes only and does not constitute investment advice. Traders are encouraged to perform their own analysis and research before making any trading decisions on EURGBP. Market conditions can change quickly, so staying informed with the latest data is essential.