Time Zone: GMT +3
Time Frame: 4 Hours (H4)
Fundamental Analysis:
Today’s fundamental outlook for BTC-USD is influenced by the upcoming USD economic data release from the US Department of the Treasury, namely the Monthly Treasury Statement. This data reflects the difference between the federal government’s income and spending. A positive actual value above forecast typically strengthens the USD, potentially exerting downward pressure on BTCUSD. Traders must closely monitor today’s economic calendar as this could lead to increased volatility in the BTCUSD pair.
Price Action:
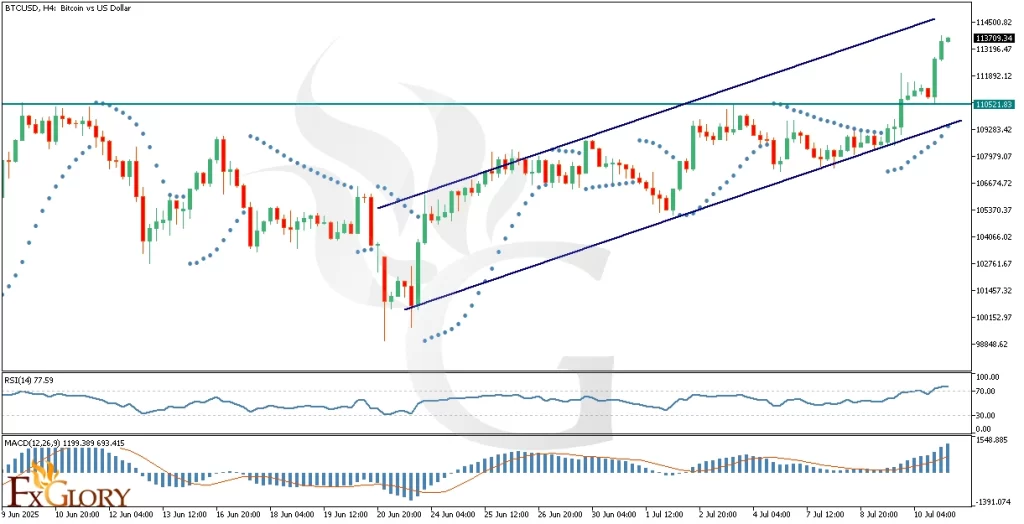
BTC USD H4 price action analysis reveals the asset recently struggled below the crucial resistance level of 110520. After considerable consolidation below this resistance, BTCUSD exhibited a robust bullish breakout, establishing a new all-time high (ATH) with a clear “Three White Soldiers” candlestick pattern. The pair is currently heading toward the upper boundary of its ascending channel. Given the recent sharp upward move, traders should prepare for a possible corrective pullback in the short term.
Key Technical Indicators:
Parabolic SAR: The Parabolic SAR dots are currently positioned below the price candles, confirming ongoing bullish sentiment. Traders may interpret this as a signal to hold long positions, yet caution is warranted due to potential short-term corrections.
RSI (Relative Strength Index): RSI has reached 77.59, clearly signaling that BTCUSD is in overbought territory. This suggests a potential imminent correction or consolidation phase, as excessive buying might taper off in the near term.
MACD (Moving Average Convergence Divergence): The MACD histogram is above the zero line and continues to grow, indicating strong bullish momentum. Despite this bullish signal, traders should stay alert to signs of divergence, as momentum could shift rapidly due to overbought conditions.
Support and Resistance:
Support: Immediate support is located at the previously broken resistance level of 110520, now acting as crucial support.
Resistance: The immediate resistance is at the upper boundary of the ascending channel near 114500, representing the next target area for bullish momentum.
Conclusion and Consideration:
BTC/USD H4 chart analysis shows robust bullish momentum, validated by the Parabolic SAR, RSI, and MACD indicators. Despite the strong bullish bias indicated by price action, overbought conditions highlighted by the RSI suggest a possible imminent correction. Traders should maintain caution, carefully monitoring the reaction at the ascending channel’s upper boundary. Additionally, the upcoming US Monthly Treasury Statement data release could introduce volatility, influencing short-term BTCUSD price movements.
Disclaimer: The analysis provided for BTC/USD is for informational purposes only and does not constitute investment advice. Traders are encouraged to perform their own analysis and research before making any trading decisions on BTCUSD. Market conditions can change quickly, so staying informed with the latest data is essential.