Time Zone: GMT +3
Time Frame: 4 Hours (H4)
Fundamental Analysis:
Today’s USD news events are anticipated to bring volatility to XAUUSD. The Chicago PMI, released by ISM-Chicago, will be closely monitored; a reading above forecasts could strengthen the USD, putting bearish pressure on gold prices. Moreover, speeches by Federal Reserve officials Raphael Bostic and Austan Goolsbee will significantly influence market sentiment. Hawkish comments hinting at future interest rate hikes could further pressure gold, typically negatively correlated with rising interest rates.
Price Action:
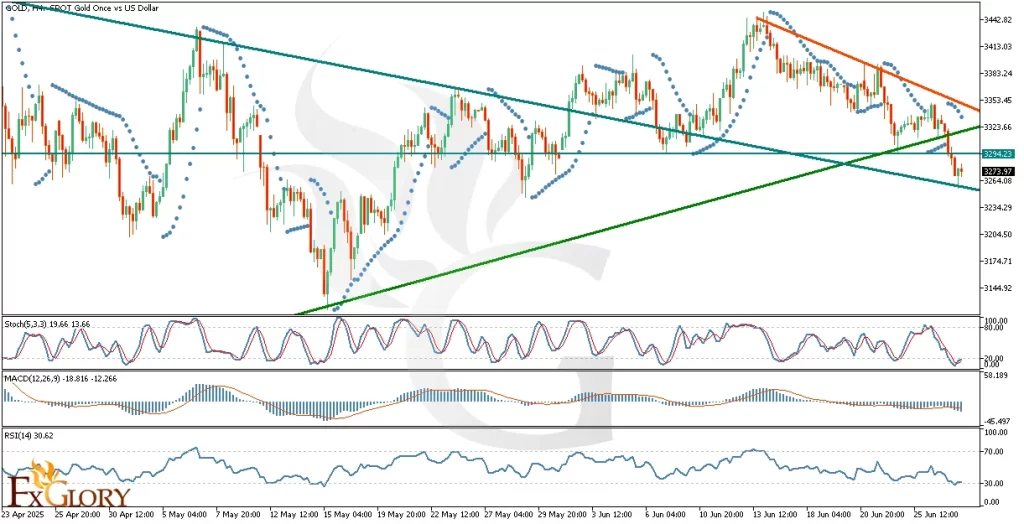
XAUUSD price action analysis in the H4 timeframe indicates a clear downward trajectory, having broken two key support lines recently. However, the latest candle formation, a bullish hammer, suggests potential bullish reaction at the third support line. Traders should watch for a possible pullback toward previously broken support levels, now acting as resistance, or monitor signs of a bullish reversal concluding the correction phase.
Key Technical Indicators:
Parabolic SAR: The Parabolic SAR dots remain positioned above the candles, confirming an ongoing bearish trend. However, the recent tightening proximity to price suggests weakening bearish momentum, potentially signaling a reversal or pullback soon.
Stochastic Oscillator: Stochastic currently resides near oversold territory, indicating potential exhaustion of selling pressure. Traders should watch for bullish crossovers as signs of possible upward correction or reversal.
MACD: MACD continues below the zero line, indicating a bearish environment. Nevertheless, the decreasing histogram bars suggest the bearish momentum is gradually weakening, hinting at a potential bullish divergence forming.
RSI (Relative Strength Index): The RSI indicator, currently at approximately 30.62, is hovering close to oversold levels, suggesting limited room for additional bearish moves. A reversal from this area could provide bullish entry signals.
Support and Resistance:
Support: Immediate support is observed near 3264.08, corresponding to recent lows and potential demand zone.
Resistance: Initial resistance is marked around 3294.25, aligning with previously broken support levels acting as new resistance.
Conclusion and Consideration:
The XAU-USD H4 technical and fundamental daily chart analysis suggests the potential for a bullish correction or reversal given the oversold technical conditions indicated by RSI and Stochastic. However, upcoming economic events related to USD can introduce volatility, significantly influencing gold’s short-term direction. Traders should cautiously monitor both fundamental developments and price action confirmations around identified support and resistance levels.
Disclaimer: The analysis provided for XAU/USD is for informational purposes only and does not constitute investment advice. Traders are encouraged to perform their own analysis and research before making any trading decisions on XAUUSD. Market conditions can change quickly, so staying informed with the latest data is essential.