Time Zone: GMT +3
Time Frame: 4 Hours (H4)
Fundamental Analysis:
Today’s USDCAD fundamental analysis will be driven by several key economic releases from both the US and Canada. For the USD, traders are awaiting critical Personal Consumption Expenditure (PCE) data, Disposable Personal Income figures, and insights into consumer spending trends. Speeches by Federal Reserve members Lisa Cook and Beth Hammack could significantly affect USD volatility, especially if comments indicate a more hawkish stance toward inflation and labor market conditions. Additionally, the University of Michigan’s consumer confidence and inflation expectation releases will be closely watched. On the CAD side, attention will center around the Gross Domestic Product (GDP) release from Statistics Canada, providing clarity on economic growth and influencing CAD valuation.
Price Action:
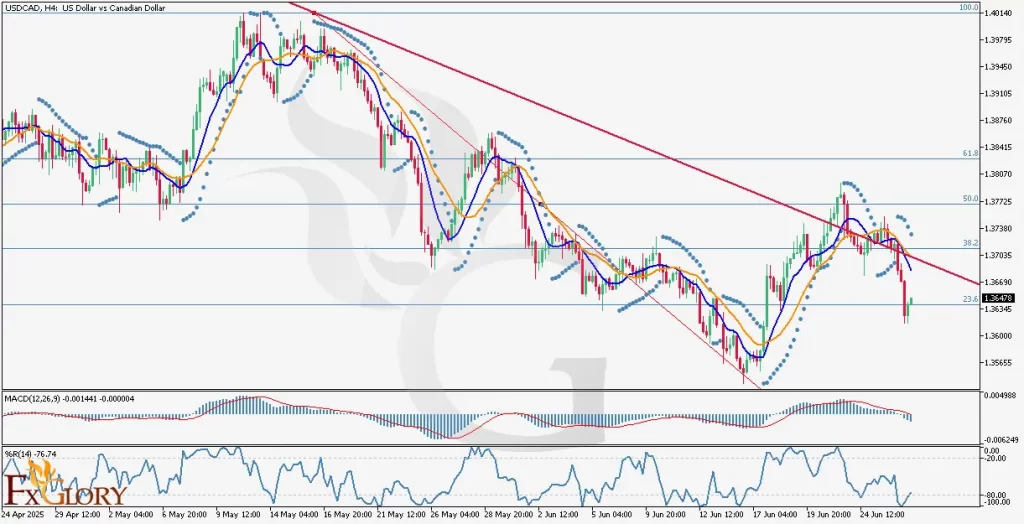
USD/CAD price action on the H4 chart indicates a bearish sentiment in the short term. After experiencing significant downward momentum, decreasing roughly 1050 points over three substantial bearish candles, the last two candles have reversed partially to green, showing potential for a short-term correction or consolidation. The overall bearish trend remains intact as the price trades below the descending trendline, highlighting continued downward pressure.
Key Technical Indicators:
Moving Averages (MA 9 and MA 17): The short-term MA (blue line, period 9) has crossed below the longer-term MA (orange line, period 17), signaling bearish sentiment. Both moving averages are sloping downward closely together, suggesting a sustained bearish momentum in the near term. Traders should monitor for potential crossovers or divergences for indications of changing market conditions.
Parabolic SAR: The Parabolic SAR indicator confirms bearish pressure, with the last four dots positioned above the price candles. This placement reinforces the bearish bias. However, the recent shift to green candles suggests cautiousness, and traders should closely observe if dots continue appearing above or start shifting below the candles, potentially indicating a reversal or consolidation.
MACD (Moving Average Convergence Divergence): The MACD shows bearish momentum as the MACD line remains below the signal line and the histogram reflects downward momentum. Nevertheless, traders should be cautious, as the histogram bars’ length is decreasing, hinting at potential weakening bearish momentum and a possible short-term reversal.
Williams %R: The %R oscillator currently reads -76.74, showing oversold market conditions. While this typically signals a potential price correction upwards, traders should look for confirmation through additional bullish price action or other technical indicators before entering long positions, given the current bearish overall bias.
Support and Resistance:
Support: Immediate support is at the 1.3634 level, marking recent lows and aligning with Fibonacci retracement levels.
Resistance: Immediate resistance is around 1.3727, coinciding with recent highs and the descending trendline resistance.
Conclusion and Consideration:
The USDCAD H4 chart analysis indicates prevailing bearish momentum supported by technical indicators such as Moving Averages, Parabolic SAR, MACD, and Williams %R. Traders should remain cautious due to potential volatility from significant economic data and central bank speakers, particularly the upcoming US PCE data and Canada’s GDP release. Monitoring support at 1.3634 and resistance at 1.3727 will be critical in gauging further directional bias.
Disclaimer: The analysis provided for USD/CAD is for informational purposes only and does not constitute investment advice. Traders are encouraged to perform their own analysis and research before making any trading decisions on USDCAD. Market conditions can change quickly, so staying informed with the latest data is essential.