Time Zone: GMT +3
Time Frame: 4 Hours (H4)
Fundamental Analysis:
Today’s fundamental outlook for the USD/CAD pair is influenced by upcoming economic data from both the United States and Canada. For the USD, traders are closely watching the University of Michigan’s Consumer Sentiment Index and Inflation Expectations data. These indicators are crucial as they reflect consumer confidence and future inflation expectations, both of which heavily influence Federal Reserve policy direction. If actual figures come out higher than forecast, the USD may see a bullish reaction due to increased prospects of tightening monetary policy.
On the Canadian side, Statistics Canada will release data regarding Capacity Utilization, Manufacturing Shipments, and Wholesale Trade. These figures serve as early signals of economic strength and inflationary pressure in Canada. If the results are strong, the CAD may benefit from increased investor confidence in the country’s economic resilience, putting further downward pressure on the USD-CAD pair.
Price Action:
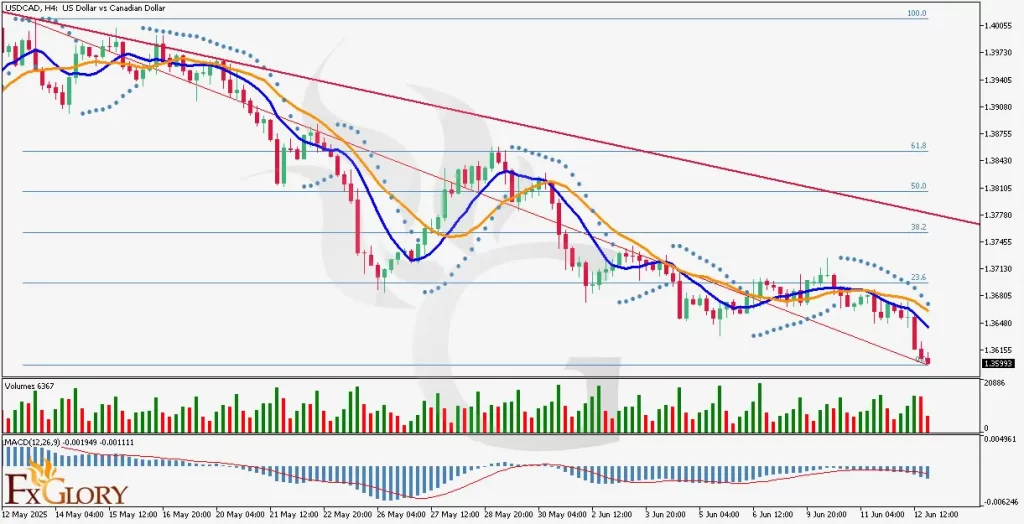
Analyzing the price action of USD CAD in the H4 chart, the pair continues its consistent bearish trend. The last few candlesticks have been predominantly red, with the latest three confirming strong bearish momentum. The USDCAD price has broken below the short-term rising support trendline and has now reached the 0.0 Fibonacci retracement level, which may act as a temporary support zone. Sellers remain in control, with no significant bullish reversal patterns currently in sight. This supports the continuation of the current downtrend, unless a strong reversal signal emerges.
Key Technical Indicators:
Moving Averages (MA – Blue 9 & Orange 17): The 9-period MA (blue) has crossed below the 17-period MA (orange), reinforcing a bearish crossover signal on the H4 chart. This alignment confirms the bearish trend continuation, and until a bullish crossover appears, short trades are technically favored in the current environment.
Parabolic SAR: The Parabolic SAR dots have formed above the candlesticks, indicating downward pressure in the market. This classic trend-following signal further supports bearish momentum and validates ongoing selling interest in USD/CAD.
Volume: Trading volume has increased on the latest bearish candles, with red bars dominating. This surge in volume accompanying price decline signals strong conviction from sellers and further weakens the likelihood of an immediate rebound.
MACD (12, 26, 9): The MACD line is below the signal line, and the histogram is printing negative values, though showing minor flattening. This indicates that bearish momentum remains intact, albeit with a hint of potential slowing. However, no bullish divergence is present, so trend continuation is still likely in the short term.
Support and Resistance:
Support: The immediate support lies near the recent 1.3530–1.3550 zone, marked by the 0.0 Fibonacci retracement level, which could serve as a short-term bounce area if sellers exhaust themselves.
Resistance: The nearest resistance level appears around the 1.3670–1.3690 zone, aligning with the 23.6% Fibonacci retracement level, where price previously struggled to break above.
Conclusion and Consideration:
The USDCAD H4 chart analysis reflects a strong bearish setup driven by aligned technical indicators such as the moving averages, parabolic SAR, MACD, and confirming price action. The pair is trading at a significant Fibonacci support level, but without a reversal pattern or divergence, bearish continuation remains likely. From a fundamental perspective, today’s US inflation expectations and Canadian manufacturing-related data may trigger volatility and decide whether this support will hold or break. Traders should monitor these economic releases closely and remain cautious of unexpected spikes.
Disclaimer: The analysis provided for USD/CAD is for informational purposes only and does not constitute investment advice. Traders are encouraged to perform their own analysis and research before making any trading decisions on USDCAD. Market conditions can change quickly, so staying informed with the latest data is essential.