Time Zone: GMT +3
Time Frame: 4 Hours (H4)
Fundamental Analysis:
The GBPUSD currency pair will experience heightened volatility today due to significant economic events from both the UK and the US. Traders will closely monitor the UK’s GDP release, Manufacturing Production, and Trade Balance figures, which will reflect the overall health of the UK economy and may influence GBP strength. For the US, numerous crucial indicators such as PPI, Retail Sales, Initial Jobless Claims, and speeches by Fed officials Mary Daly and Jerome Powell could provide significant insights into future US monetary policy. More hawkish tones from these speeches or stronger-than-expected economic data would likely boost the USD, potentially placing downward pressure on the GBPUSD pair.
Price Action:
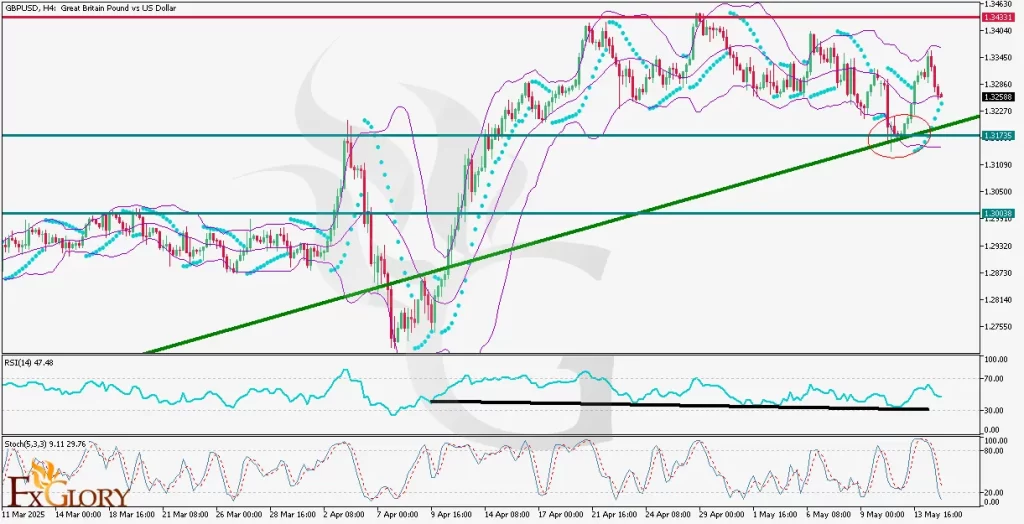
The GBP-USD pair on the H4 chart recently pulled back from the upper Bollinger Band, retreating to test the middle Bollinger Band. This mid-band area acts as critical immediate support, and a failure here might see the pair challenging the ascending trendline near the 1.31735 level. Should this key trendline fail to hold, a deeper correction towards the psychological support at 1.30038 might be seen. Conversely, bullish recovery above the mid-band may drive the price to retest the major resistance at 1.34331.
Key Technical Indicators:
Bollinger Bands: The Bollinger Bands for GBP/USD are currently converging, indicating reduced volatility and a potential upcoming breakout. The price reacted from the upper band and is testing support at the middle band. A decisive break below the middle band could signal increased bearish momentum.
Parabolic SAR: The Parabolic SAR dots have recently switched below the price, signaling a potential bullish reversal on this timeframe. However, traders should remain cautious and confirm this bullish signal with price action.
RSI (Relative Strength Index): A divergence between price action and RSI is evident, with RSI making lower highs while the price recently made higher highs, suggesting weakening bullish momentum and potential bearish reversal ahead.
Stochastic Oscillator: The stochastic oscillator is approaching oversold conditions, currently at 9.11 and 29.76. This suggests that a short-term bounce might occur soon if the price finds support, potentially limiting immediate downside risk.
Support and Resistance:
Support: Immediate support is located at 1.31735, aligning with the ascending trendline and previous price action area. The next significant support lies at the psychological level of 1.30038, historically significant for price reversals.
Resistance: Immediate resistance stands at the recent swing high at 1.34331, representing a critical barrier for bulls to overcome for continued upward momentum.
Conclusion and Consideration:
The GBP-USD H4 technical and fundamental daily chart analysis reveals a critical juncture for the pair. Current indicators suggest mixed signals, indicating caution in both directions. Traders should pay close attention to today’s economic events and news releases, as significant volatility is anticipated. Proper risk management and close monitoring of price action around key levels and economic announcements are strongly recommended.
Disclaimer: The analysis provided for GBP/USD is for informational purposes only and does not constitute investment advice. Traders are encouraged to perform their own analysis and research before making any trading decisions on GBPUSD Market conditions can change quickly, so staying informed with the latest data is essential.