Time Zone: GMT +3
Time Frame: 4 Hours (H4)
Fundamental Analysis:
Today, the AUD/USD pair faces significant volatility from critical economic news releases from Australia and the US. From Australia, employment data, including Employment Change and Unemployment Rate, will be in focus. Better-than-expected employment figures and a lower unemployment rate could strengthen the Australian Dollar, reflecting positive economic health and potentially increased consumer spending. Additionally, the NAB Business Confidence survey provides insights into the sentiment among Australian businesses, serving as a leading indicator for economic activity. On the US side, investors will closely watch the Treasury International Capital (TIC) data, Initial Jobless Claims, Philadelphia Fed Manufacturing Index, Residential Building Permits, Housing Starts, and Natural Gas Storage reports. Furthermore, speeches from Federal Reserve officials Michael Barr and Jeffrey Schmid will be scrutinized for signals on future monetary policy direction. Positive US data or hawkish Fed commentary could bolster the US Dollar, impacting AUDUSD price dynamics significantly.
Price Action:
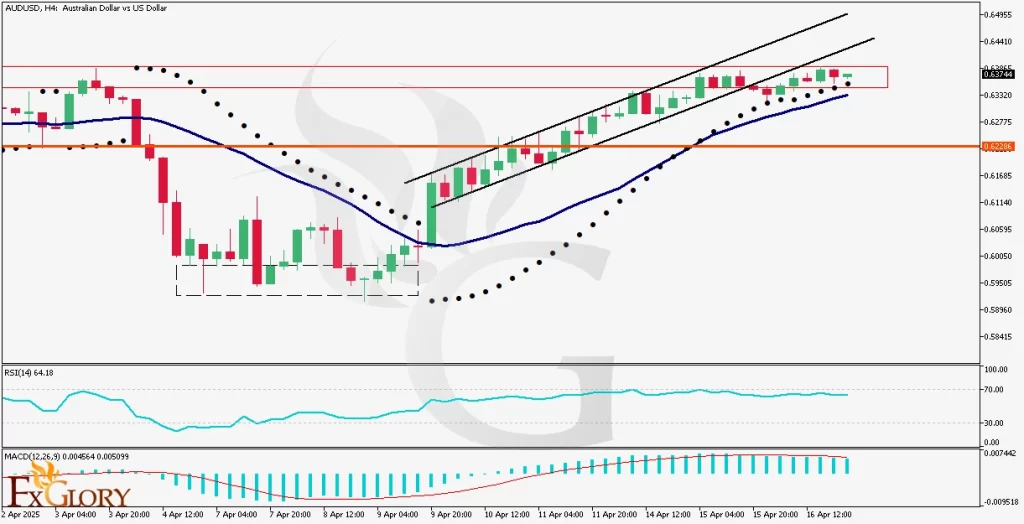
The AUD-USD H4 chart has exhibited bullish momentum after shaping a clear double-bottom pattern, indicating a significant trend reversal. The price has recently breached the lower boundary of its ascending channel and is currently attempting a pullback towards the previously broken support level at 0.62286. At present, price action remains within a key resistance zone. If bullish momentum persists and the resistance is convincingly broken, the next potential target would be the upper boundary of the ascending channel. Conversely, failure to break this resistance could push the pair down to retest the EMA21 line or further down to the key level at 0.62286.
Key Technical Indicators:
EMA 21: The EMA 21 line is currently below the price, providing dynamic support and confirming the ongoing bullish momentum. Traders should watch for interactions with this line as a potential turning point.
Parabolic SAR: The Parabolic SAR dots remain below the price candles, indicating bullish sentiment remains intact for now. Traders should look for any flips of SAR dots to signal possible short-term reversals.
RSI: The RSI currently stands at 64.18, indicating moderately bullish momentum without being overbought. This suggests the pair may still have room for further upward movement before encountering significant selling pressure.
MACD: The MACD histogram is positive but declining, hinting at diminishing bullish momentum. Traders should watch closely for a potential bearish crossover, which could signal the onset of a corrective move or bearish reversal.
Support and Resistance:
Support: Immediate dynamic support is at the EMA 21 line, followed by a key support level at 0.62286.
Resistance: Current resistance lies within the range of 0.6370 to 0.6380, coinciding with recent price action highs. Further resistance could be encountered at the upper channel boundary around 0.6400-0.6410.
Conclusion and Consideration:
The AUD USD pair remains bullish on the H4 timeframe, supported by price action and technical indicators. Traders should closely monitor today’s significant USD news events, which are likely to increase volatility and could influence directional moves. If resistance at the 0.6370-0.6380 zone breaks, traders can expect further bullish continuation towards the channel’s upper boundary. However, caution is advised due to the weakening MACD momentum and potential fundamental disruptions.
Disclaimer: The analysis provided for AUD/USD is for informational purposes only and does not constitute investment advice. Traders are encouraged to perform their own analysis and research before making any trading decisions on AUDUSD. Market conditions can change quickly, so staying informed with the latest data is essential.