Time Zone: GMT +2
Time Frame: 4 Hours (H4)
Fundamental Analysis:
GOLD-USD (XAU/USD) is currently experiencing volatility influenced by today’s significant economic news releases from the US. Upcoming remarks by US President Donald Trump concerning auto tariffs and the scheduled interview with Newsmax TV may create substantial fluctuations in USD valuation, directly impacting GOLD USD price movements. Additionally, critical economic indicators such as GDP data, Initial Jobless Claims, GDP Price Index, Trade Balance, Wholesale Inventories, Pending Home Sales, and Natural Gas Storage reports will further dictate market sentiment and trading volumes. Traders should remain cautious and monitor these fundamental catalysts closely for potential trading opportunities.
Price Action:
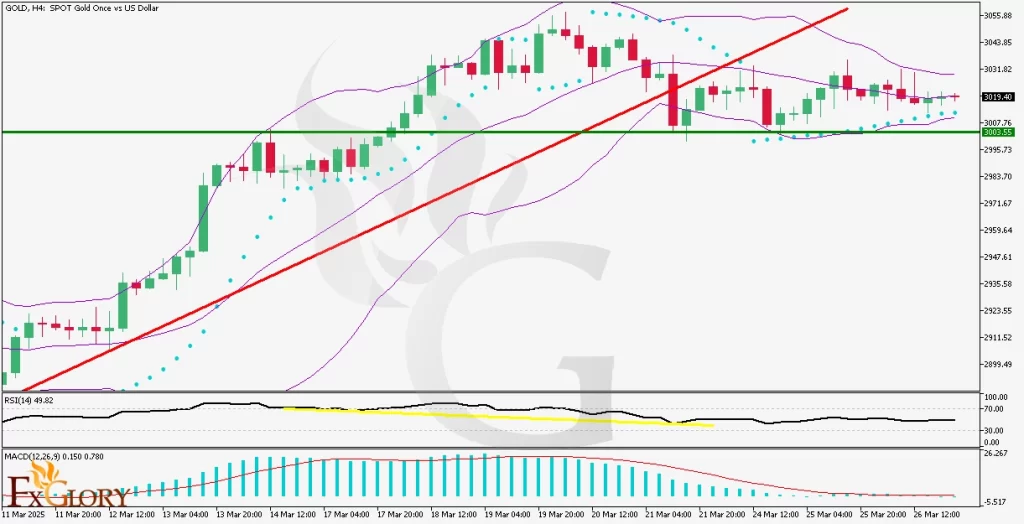
The H4 chart for XAU/USD indicates a corrective scenario, with the price recently breaking below key support lines and now hovering around a crucial horizontal support zone. This level aligns closely with the lower boundary of the Bollinger Bands, suggesting potential for a short-term consolidation or possible reversal. Recent candles display indecision, reflecting market uncertainty as buyers and sellers struggle to establish control. This price action indicates a pivotal moment for GOLD-USD, warranting careful monitoring for confirmation signals.
Key Technical Indicators:
Bollinger Bands: Bollinger Bands have contracted significantly, indicating low market volatility and signaling an impending breakout. Currently, GOLDUSD price is near the middle Bollinger Band (moving average), suggesting equilibrium between buyers and sellers. Traders should watch closely for a decisive breakout from the bands to determine the next significant market direction.
RSI (Relative Strength Index): The RSI currently shows clear bearish divergence, indicating weakening bullish momentum. At a level of around 49.82, RSI is neutral but the divergence suggests a potential downward corrective movement. This confirms the price action signal of possible further bearish pressure.
Parabolic SAR: The Parabolic SAR dots are positioned above the current price candles, clearly signaling bearish sentiment and suggesting the short-term trend favors sellers. Traders should view this as confirmation of the potential continuation of downward movement unless dots shift below price candles.
MACD (Moving Average Convergence Divergence): MACD histogram bars are decreasing and approaching the zero line, indicating weakening bullish momentum and a potential bearish crossover. If a crossover occurs, this would strengthen the bearish outlook significantly and provide further confirmation for downward price potential.
Support and Resistance:
Support: Immediate horizontal support is clearly defined around the 3003.55 level, a critical zone aligning with the lower Bollinger Band, providing a strong base for short-term price action.
Resistance: Immediate resistance is identified around the 3035.00 mark, where the upper Bollinger Band and recent trend line converge, representing significant technical hurdles for bullish attempts.
Conclusion and Consideration:
The current technical scenario for XAUUSD on the H4 timeframe strongly indicates caution due to a potential bearish corrective move. Bearish divergence on RSI, Parabolic SAR indications, and weakening MACD histogram all collectively confirm this potential downside risk. However, significant fundamental catalysts from the US today could introduce volatility, altering the current technical setup. Traders are advised to carefully observe the price reaction around key support at 3003.55 and resistance at 3035.00, considering both technical confirmations and fundamental developments.
Disclaimer: The analysis provided for GOLD/USD is for informational purposes only and does not constitute investment advice. Traders are encouraged to perform their own analysis and research before making any trading decisions on GOLDUSD. Market conditions can change quickly, so staying informed with the latest data is essential.