Time Zone: GMT +2
Time Frame: 4 Hours (H4)
Fundamental Analysis
The USDJPY currency pair remains sensitive today with important economic indicators scheduled. For JPY, upcoming releases include Japan’s Machine Orders, Adjusted Merchandise Trade Balance, and Industrial Production, all crucial leading indicators of economic activity and currency strength. The Bank of Japan’s monetary policy outlook and recent interest rate statements also continue to influence JPY. Conversely, for the USD, traders will closely watch the EIA Crude Oil Inventories, a key measure influencing the US Dollar through energy market sentiment. These fundamental releases could significantly impact USDJPY volatility.
Price Action
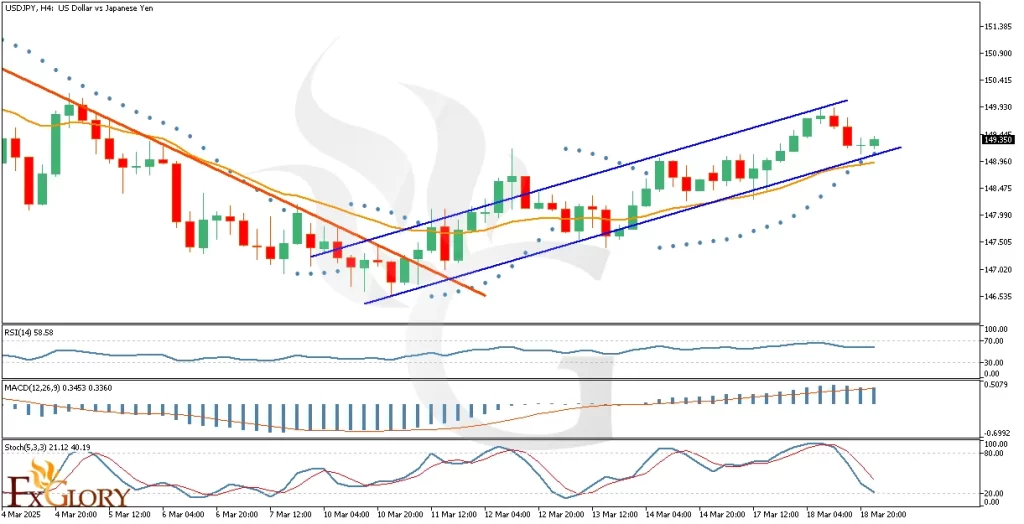
USDJPY price action analysis in the H4 timeframe reveals a confirmed bullish reversal. After breaking the downtrend line, price has entered an ascending channel, currently testing the lower boundary and coinciding with EMA support zones. Recent candles suggest bullish sentiment may continue, targeting the upper boundary of the ascending channel, reinforcing the bullish outlook.
Key Technical Indicators
Parabolic SAR: The Parabolic SAR dots are positioned below recent candles, indicating bullish momentum and a positive trend continuation signal for USDJPY.
EMA (Exponential Moving Average): Price remains above both the short-term and medium-term EMA lines, highlighting bullish support that can propel USDJPY higher.
RSI (Relative Strength Index): Currently at 58.58, RSI remains comfortably within neutral territory, suggesting sufficient room for further bullish movement without immediate risk of overbought conditions.
MACD (Moving Average Convergence Divergence): MACD is above the signal line, maintaining positive values, indicative of sustained bullish momentum, although recent histogram bars are shorter, signaling slightly decreased buying momentum.
Stochastic Oscillator: The stochastic oscillator has recently approached the oversold region and is now curving upwards, providing a bullish crossover that indicates renewed buying interest could lift prices further.
Support and Resistance
Support: Immediate support lies at the lower boundary of the ascending channel at approximately 148.900, strengthened by EMA convergence.
Resistance: Key resistance is observed near the upper boundary of the ascending channel at approximately 149.900, marking recent price highs.
Conclusion and Consideration
The current H4 analysis for USDJPY indicates bullish momentum supported by key technical indicators such as Parabolic SAR, EMA, RSI, MACD, and Stochastic oscillator. The ascending channel supports further bullish sentiment. Traders must remain cautious and monitor upcoming fundamental economic data releases closely, which can significantly affect the USDJPY exchange rate, leading to potential volatility.
Disclaimer: The analysis provided for USD/JPY is for informational purposes only and does not constitute investment advice. Traders are encouraged to perform their own analysis and research before making any trading decisions on USDJPY. Market conditions can change quickly, so staying informed with the latest data is essential.