Time Zone: GMT +2
Time Frame: 4 Hours (H4)
Fundamental Analysis
The NZD/USD currency pair represents the exchange rate between the New Zealand Dollar (NZD) and the US Dollar (USD). Today, NZD may experience volatility due to the upcoming Global Dairy Trade (GDT) data release, a significant indicator of New Zealand’s economic health, as higher dairy product prices typically strengthen the NZD. The US Dollar could also see significant movement today with the release of key economic data, including Residential Building Permits, Housing Starts, Import Prices, Capacity Utilization Rate, and Industrial Production. Positive outcomes in these indicators usually support the USD, adding bearish pressure on the NZDUSD pair.
Price Action
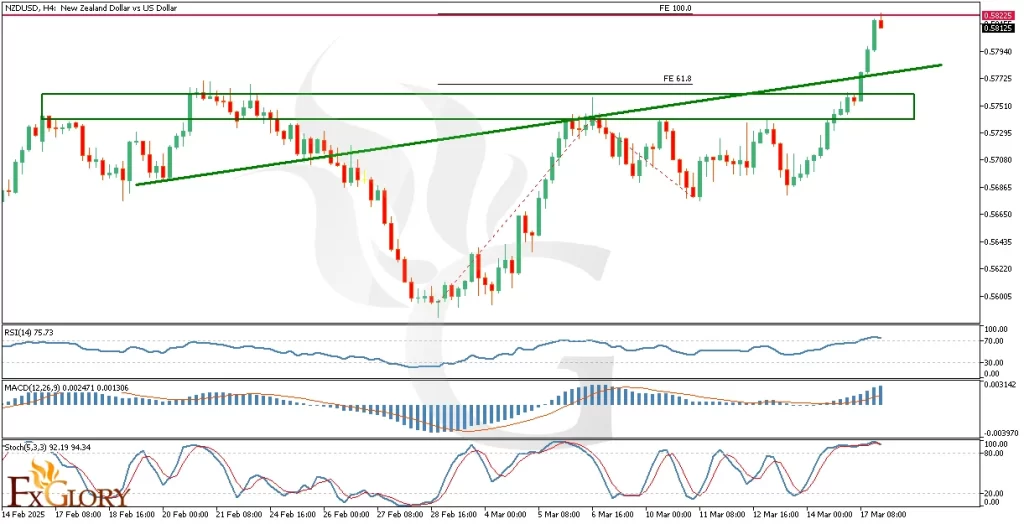
The NZD-USD pair analysis on the H4 timeframe demonstrates a strong bullish breakout above the previous resistance zone, now converted into support. Currently, the price has reached the Fibonacci expansion level of 100.0, indicating a high probability of a corrective pullback. Initially, the price is expected to retrace toward the ascending support trendline, followed by a potential deeper correction toward the horizontal support zone.
Key Technical Indicators
RSI (Relative Strength Index): The RSI indicator currently reads 75.73, indicating an overbought scenario. This suggests a probable price correction in the short term to ease the overbought condition.
MACD (Moving Average Convergence Divergence): The MACD histogram remains bullish, although diminishing momentum indicates potential weakening buying pressure. Traders should be alert for a bearish crossover that could signal a reversal or pullback.
Stochastic Oscillator: The Stochastic Oscillator shows a strongly overbought condition at levels 92.19 and 94.34, emphasizing the likelihood of an imminent short-term correction.
Support and Resistance
Support: Immediate support is located at the ascending trendline near 0.5770, followed by a key horizontal support zone around 0.5730-0.5725.
Resistance: The nearest resistance level is at the recent peak near 0.5822, coinciding with the Fibonacci Expansion 100.0 level. Further resistance can be observed at the psychological mark of 0.5850.
Conclusion and Consideration
The NZD/USD pair forecast on the H4 chart suggests continued bullish momentum, supported by current price action and technical indicators. However, the overbought conditions indicated by RSI and Stochastic suggest the pair is likely to see a corrective move soon. Traders should monitor upcoming economic news closely, especially GDT and US economic indicators, which could significantly impact the NZD-USD exchange rate.
Disclaimer: The analysis provided for NZD/USD is for informational purposes only and does not constitute investment advice. Traders are encouraged to perform their own analysis and research before making any trading decisions on NZDUSD. Market conditions can change quickly, so staying informed with the latest data is essential.