Time Zone: GMT +2
Time Frame: 4 Hours (H4)
Fundamental Analysis:
The GBP-USD currency pair is currently influenced by key economic indicators from the US and UK. Today, traders are focusing on the US Consumer Price Index (CPI) data, which plays a crucial role in shaping the Federal Reserve’s monetary policy. A higher-than-expected CPI reading could strengthen the USD as it may push the Fed towards maintaining or increasing interest rates. Additionally, the US Crude Oil Inventories report will provide insight into energy price trends, which indirectly impact inflation expectations and the USD’s movement. From the UK side, no major economic events are scheduled today, leaving the GBP vulnerable to USD-driven volatility. However, ongoing discussions regarding fiscal policies and global economic uncertainty may influence market sentiment.
Price Action:
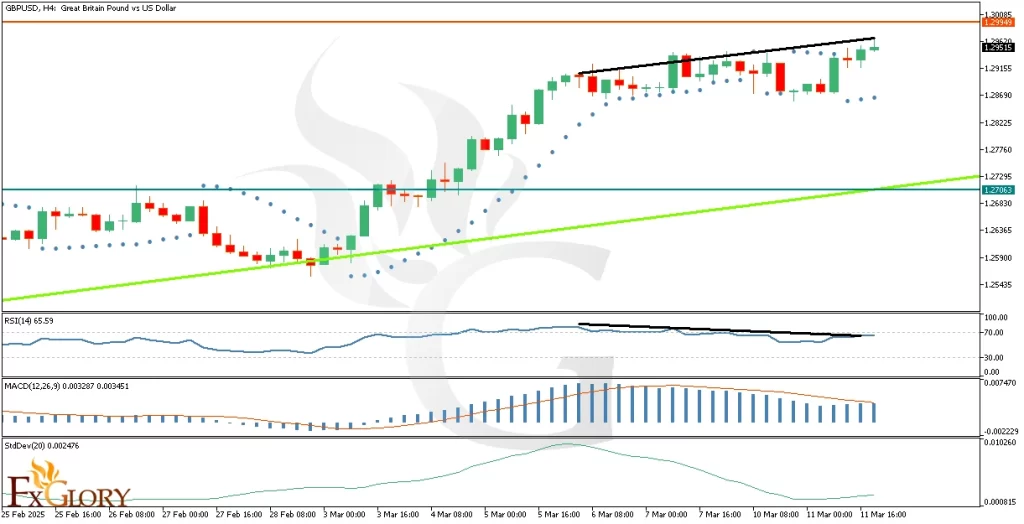
The GBP/USD H4 chart analysis shows that the pair is approaching a significant resistance level around 1.2934 – 1.3000. The bullish momentum appears to be fading, as evidenced by a bearish divergence forming on the RSI and MACD indicators. Over the past sessions, price action has shown a consistent upward trend, but the slowing momentum suggests a potential correction. If the price fails to break the resistance, it may retrace toward the nearest support levels at 1.2706 or the ascending trendline. A potential breakout above 1.3000 could drive further gains, but considering the overextended bullish move and weakening momentum, a retracement seems more probable.
Key Technical Indicators:
Parabolic SAR: The last three dots of the Parabolic SAR are below the price, confirming an ongoing uptrend. However, if the dots flip above the price, it would signal a potential reversal or consolidation phase.
RSI (Relative Strength Index): A divergence can be seen between price and RSI, as the price makes higher highs while RSI moves lower. This indicates weakening bullish momentum and an increasing possibility of a price correction. Additionally, the RSI is near the overbought zone (65.59), suggesting limited upside potential.
MACD (Moving Average Convergence Divergence): The MACD histogram is declining, and the signal line is converging with the MACD line, hinting at a weakening bullish trend. A bearish crossover could indicate a reversal or a deeper pullback.
Standard Deviation Oscillator: The standard deviation oscillator shows a decrease in volatility, indicating reduced momentum. This aligns with the observation that price action is struggling to break resistance, increasing the likelihood of a corrective move.
Support and Resistance:
Support: Immediate support is located at 1.2706, which aligns with the ascending trendline and previous price consolidation area.
Resistance: The nearest resistance level is at 1.2934 – 1.3000, which coincides with recent highs and the upper boundary of the trend.
Conclusion and Consideration:
The GBP Vs. USD pair on the H4 chart shows sustained bullish momentum, but technical indicators signal a potential slowdown. The RSI divergence, declining MACD momentum, and reduced volatility indicate that a correction could be imminent. Traders should watch for confirmation of a bearish reversal, especially if the price fails to break 1.3000. A retracement toward 1.2706 is possible if selling pressure increases. Given the importance of today’s US CPI release, market volatility may surge, influencing the pair’s direction. Traders should stay cautious and incorporate risk management strategies while trading around key levels.
Disclaimer: The analysis provided for GBP/USD is for informational purposes only and does not constitute investment advice. Traders are encouraged to perform their own analysis and research before making any trading decisions on GBP-USD. Market conditions can change quickly, so staying informed with the latest data is essential.