Time Zone: GMT +2
Time Frame: 4 Hours (H4)
Fundamental Analysis
EUR/USD is currently influenced by several high-impact events, including Europe’s new purchase orders data and foreign trade figures, as well as a scheduled speech by ECB President Christine Lagarde. Traders are closely monitoring Euro area Employment and GDP releases for additional insight into the region’s economic strength. Meanwhile, the US Dollar faces potential volatility from multiple Federal Reserve (FOMC) member speeches and labor market data (NFP, Unemployment Rate), which could shape market sentiment on monetary policy. Overall, these EUR USD daily chart technical and fundamental analysis factors suggest heightened price action and possible shifts in momentum on the H4 timeframe.
Price Action
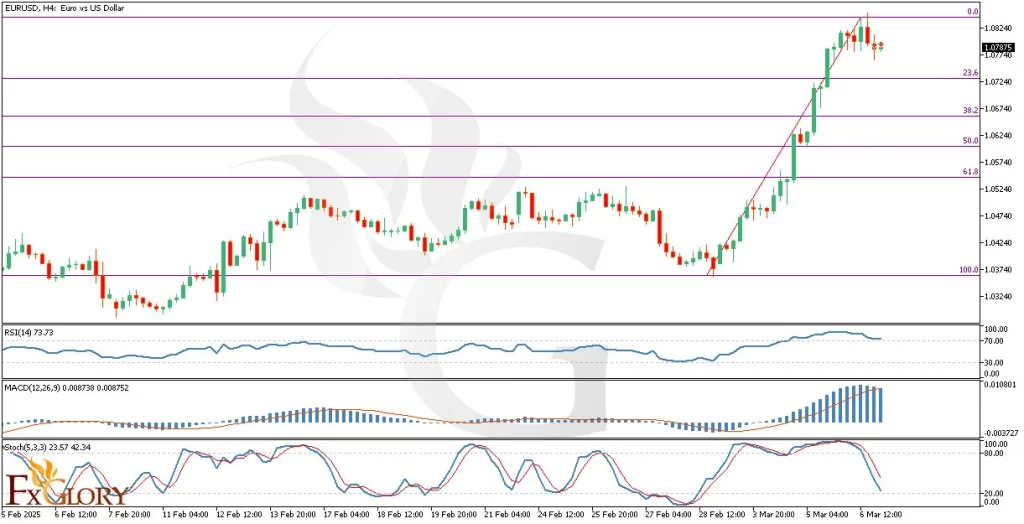
The EUR USD H4 chart shows a strong initial upswing since the market opened this week, followed by three consecutive red candles indicating a possible correction. If the bearish movement extends, price action may test the 23.6% Fibonacci Retracement, with potential deeper pullbacks toward the 50% and 61.8% levels. This EURUSD daily technical analysis suggests traders should monitor these key retracement zones for signs of reversal or continuation, as the pair’s momentum could shift rapidly in response to ongoing fundamental developments.
Key Technical Indicators
RSI (Relative Strength Index): The RSI has moved near overbought territory following the recent sharp rally, signaling that the bullish momentum may be losing steam. With the last three bearish candles, RSI is gradually easing, suggesting a potential cooldown in buying pressure. However, a sustained move below the 50 mark could confirm a deeper correction for EURUSD price action.
MACD (Moving Average Convergence Divergence): The MACD line remains above the signal line, reflecting the recent bullish surge on the EUR-USD H4 chart. Nonetheless, the histogram is starting to narrow, indicating that upward momentum may be slowing. A crossover below the signal line could reinforce a short-term bearish correction scenario.
Stochastic Oscillator: Stochastic readings are hovering in high territory, supporting the notion that EUR USD could be ripe for a pullback. The oscillator’s downward slope from overbought levels suggests a likely pause in the bullish trend. A clear break below the 80 line often points to growing bearish pressure.
Support and Resistance
Support: The support zone, defined by the 23.6%, 50%, and 61.8% Fibonacci levels at 1.0680, 1.0640, and 1.0600 respectively, forms a layered cushion where buyers may step in during corrections. A bounce off these levels would reinforce bullish sentiment, while a break could signal a shift toward stronger bearish momentum.
Resistance: Resistance is observed at 1.0750, the recent swing high, and at 1.0800, a key psychological barrier, where selling pressure has previously emerged. A successful break above these levels could validate further bullish momentum, whereas failure to breach them may lead to profit taking and a potential retracement.
Conclusion and Consideration
EUR/USD appears poised for a potential corrective move on the H4 chart, with fundamental news and technical signals aligning to indicate caution. Traders should keep an eye on key Fibonacci levels, as well as RSI, MACD, and Stochastic Oscillator readings for confirmation of further downside or a bullish continuation. The upcoming Eurozone data and multiple US FOMC statements could amplify market volatility, so monitoring both technical and fundamental factors is essential.
Disclaimer: The analysis provided for EUR/USD is for informational purposes only and does not constitute investment advice. Traders are encouraged to perform their own analysis and research before making any trading decisions on EURUSD. Market conditions can change quickly, so staying informed with the latest data is essential.