Time Zone: GMT +2
Time Frame: 4 Hours (H4)
Fundamental Analysis:
EUR/USD H4 traders are closely monitoring the US Dollar amid multiple economic events today, including a speech by Federal Reserve Bank of Philadelphia President Patrick Harker, a press conference featuring US President Donald Trump, and key releases such as Core PCE and Personal Spending—critical indicators for gauging inflation and consumer behavior in the US. The Federal Reserve’s ongoing stance on monetary policy, influenced by these data points, may stir volatility for the USD. Meanwhile, the Euro faces potential fluctuations with upcoming German Import Price Index and Retail Sales figures, as well as French Consumer Spending data, reflecting the Eurozone’s economic health. Any deviation from expectations in these high-impact releases could shift the EUR USD price action significantly in the short term.
Price Action:
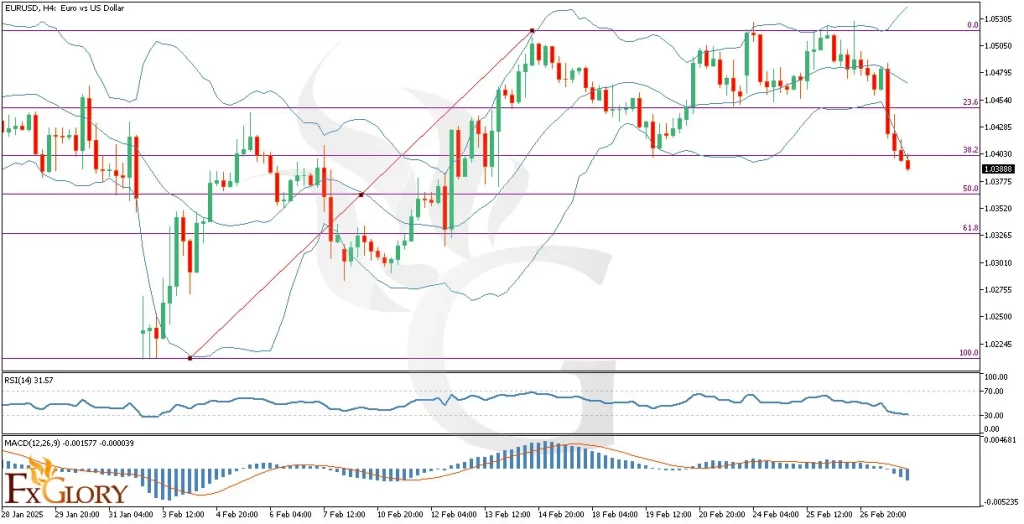
The EURUSD H4 chart daily analysis shows that the price has been moving downward, with only four out of the last thirteen candles closing bullish while the rest have been bearish. This bearish momentum has positioned the pair near the lower half of the Bollinger Bands, signaling persistent selling pressure. In recent sessions, the last four candles have touched the lower Bollinger Band, indicating a potential oversold condition but also hinting at continued downside risk. The pair is attempting to breach the 38.2% Fibonacci retracement level, and a successful break lower could drive the price toward the 50% Fib level, reinforcing the near-term bearish bias in this price action analysis.
Key Technical Indicators:
Bollinger Bands: The price is trading in the lower half of the Bollinger Bands, highlighting the EURUSD’s current downward pressure on the H4 chart. The last four candles have repeatedly tested the lower band, suggesting strong selling momentum. Any decisive break below the lower band could accelerate the bearish trend, while a bounce might signal a short-term corrective move. Traders should watch for a potential band squeeze, which often precedes a volatility spike.
RSI (Relative Strength Index): The RSI on the EURUSD H4 remains in a lower range, reflecting the bearish tilt in this technical analysis. While not yet extremely oversold, the indicator is approaching levels that often lead to a short-term rebound in price. If the RSI dips below 30, it may trigger a corrective pullback; however, staying above 30 would confirm continued downward momentum. Monitoring RSI divergence with price could provide early signals of a trend reversal.
MACD (Moving Average Convergence Divergence): The MACD line is trending below the signal line, aligning with the bearish momentum in the EUR-USD H4 price action. The histogram remains in negative territory, indicating that selling pressure is still dominant. A further widening between the MACD and signal lines would reinforce the downward bias, while a crossover could suggest a possible shift toward bullish consolidation. Traders should keep an eye on MACD convergence or divergence near critical support levels.
Support and Resistance:
Support: Immediate support is located at 1.0420, which aligns with a recent pivot zone and the lower region of the Bollinger Bands. A break below this area may see price retesting 1.0380, a level of previous consolidation.
Resistance: The nearest resistance is at 1.0480, coinciding with a recent swing high on the H4 chart. A decisive break above this region could open the path toward 1.0520, reinforcing a potential bullish correction.
Conclusion and Consideration:
The EURUSD H4 chart daily analysis points to a prevailing bearish sentiment, underscored by the downward trajectory in price action and confirmed by key technical indicators such as Bollinger Bands, RSI, and MACD. Fundamental factors, including pivotal US data releases and Eurozone economic reports, may inject additional volatility into the market. Traders should remain cautious and adapt their strategies to potential rapid price shifts as key support and resistance levels come into play.
Disclaimer: The analysis provided for EUR/USD is for informational purposes only and does not constitute investment advice. Traders are encouraged to perform their own analysis and research before making any trading decisions on EURUSD. Market conditions can change quickly, so staying informed with the latest data is essential.