Time Zone: GMT +2
Time Frame: 4 Hours (H4)
Fundamental Analysis:
The EURUSD pair is currently experiencing a critical juncture driven by fundamental economic data and central bank developments. Today, the focus remains on the S&P Global PMI data for both the Eurozone and the United States, which serve as key indicators of economic health. The Eurozone PMI is expected to show whether the manufacturing and services sectors are expanding or contracting, which could provide significant direction for the euro. Meanwhile, the U.S. Federal Reserve speeches today may offer insights into future interest rate policies, potentially impacting USD volatility. Additionally, President Trump’s speech at the Republican Governors Association Meeting could add further market fluctuations depending on any remarks regarding economic policies or fiscal measures.
Price Action:
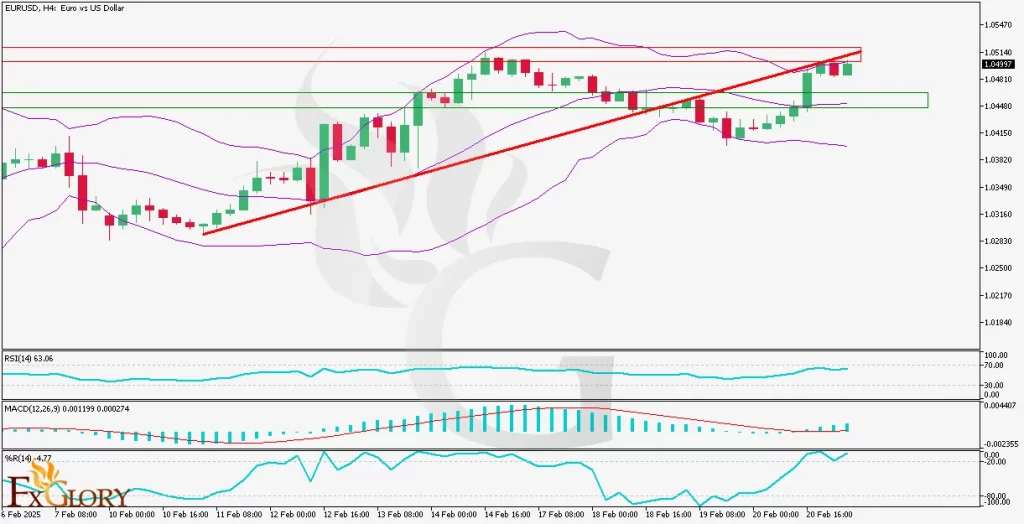
The EUR/USD price has reached a strong resistance zone, which aligns with the upper Bollinger Band and a previous trendline resistance level, making it a difficult area to break through. The price is expected to retrace toward the green support zone, which also coincides with the middle Bollinger Band (moving average). Given the rejection from resistance, a short-term pullback is likely before another attempt at breaking higher levels. However, if buyers gain control, a breakout beyond this resistance could push prices higher.
Key Technical Indicators:
Bollinger Bands: The EUR-USD price is currently at the upper Bollinger Band, indicating an overextended movement that could lead to a price correction. A retracement toward the middle Bollinger Band (the 20-period moving average) at 1.0440 is likely, making it an important support area for a potential bounce.
RSI (Relative Strength Index): The RSI is currently at 63.06, suggesting that the market is approaching overbought conditions. Additionally, a divergence is forming, which means that while price is making new highs, RSI is not confirming the strength. This increases the probability of a short-term bearish correction.
MACD (Moving Average Convergence Divergence): The MACD histogram is showing weakening bullish momentum, with the MACD line flattening above the signal line. This suggests that while the trend remains bullish, the buying pressure is decreasing. If a bearish crossover occurs, it could confirm a short-term pullback toward support levels.
%R (Williams %R): The %R indicator is currently at -4.77, which indicates that the market is in extreme overbought conditions. This aligns with the resistance level and suggests that a correction is likely in the short term.
Support and Resistance:
Support: Immediate support is located at 1.0440, which aligns with the middle Bollinger Band and a recent price consolidation area.
Resistance: The nearest resistance level is at 1.0515, which coincides with the upper boundary of the ascending channel and recent highs.
Conclusion and Consideration:
The EUR Vs. USD pair on the H4 timeframe is facing a strong resistance zone, aligning with multiple technical indicators signaling an overbought condition. A potential pullback toward the 1.0440 support level is likely before another move higher. However, if price breaks above the resistance at 1.0515, bullish momentum could extend toward 1.0545. Traders should monitor upcoming economic releases, including PMI reports and Federal Reserve speeches, as they could drive volatility and influence the next directional move.
Disclaimer: The analysis provided for EUR/USD is for informational purposes only and does not constitute investment advice. Traders are encouraged to perform their own analysis and research before making any trading decisions on EURUSD. Market conditions can change quickly, so staying informed with the latest data is essential.