Time Zone: GMT +2
Time Frame: 4 Hours (H4)
Fundamental Analysis:
The EUR/USD pair is experiencing strong movements driven by key economic releases from both the Eurozone and the United States. In the Eurozone, today’s Wholesale Price Index (WPI) data is expected to impact inflation expectations, as an increase in wholesale prices often leads to higher consumer prices, strengthening the Euro (EUR). Additionally, the Eurozone Employment Change and GDP (Gross Domestic Product) reports will provide deeper insights into labor market conditions and overall economic growth, influencing market sentiment.
On the U.S. side, the key focus will be on the Retail Sales data, which serves as a major indicator of consumer spending, along with the Import Price Index and Industrial Production figures. A stronger-than-expected U.S. Retail Sales report could reinforce expectations for tighter monetary policy from the Federal Reserve (Fed), potentially boosting the U.S. Dollar (USD) and limiting EUR/USD gains. Given these factors, traders should expect increased volatility in the EURUSD pair.
Price Action:
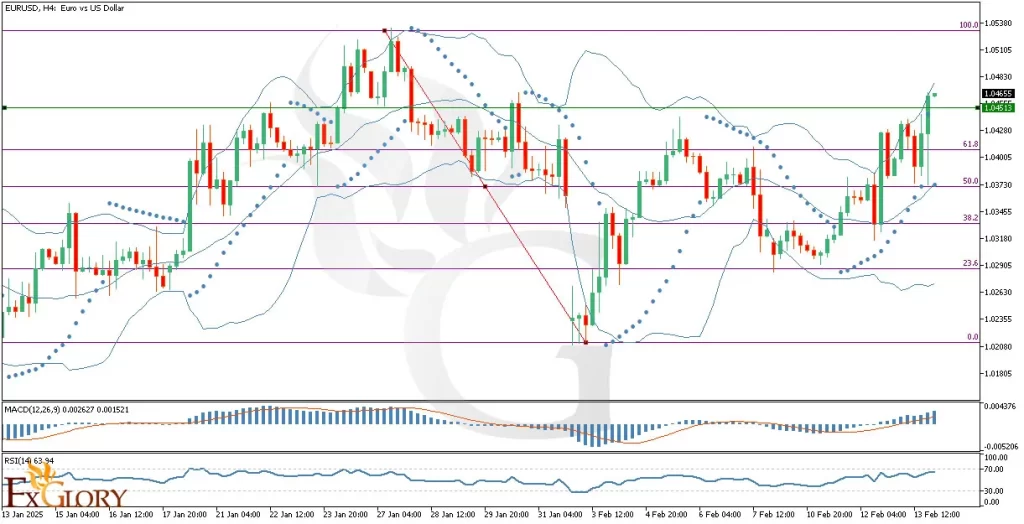
The EUR/USD H4 chart displays a bullish trend, as confirmed by the last three consecutive green candles, showing strong buying momentum. The price is currently trading in the upper half of the Bollinger Bands, touching the upper band, which signals increased bullish pressure. Additionally, the EUR-USD price has successfully broken above the 61.8% Fibonacci retracement level, a key resistance area, and is now approaching the 100% Fibonacci retracement level, indicating a potential continuation of the uptrend. Another key confirmation of the bullish trend is the Parabolic SAR, with 15 blue dots positioned below the price candles, further reinforcing the dominance of buyers in the market. As long as these dots remain below the price, the uptrend is expected to continue, with the next target being the 1.0485 resistance level (100% Fibonacci level).
Key Technical Indicators:
Bollinger Bands: The EURUSD price is currently trading in the upper half of the Bollinger Bands and touching the upper band, signaling strong bullish momentum. If the price continues pushing above the upper band, it may indicate an extended rally. However, a short-term pullback towards the middle band (around the 50% Fibonacci retracement level) could occur before further upside continuation.
Parabolic SAR: The 15 SteelBlue Parabolic SAR dots positioned below the candles confirm a strong bullish trend. As long as these dots remain beneath the EURUSD price, the market remains in an uptrend. A reversal signal would only emerge if the dots shift above the candles, which would indicate potential selling pressure.
MACD (Moving Average Convergence Divergence): The MACD line is above the signal line, and the histogram is increasing, further confirming bullish momentum. This suggests growing buying pressure, supporting a potential move towards higher resistance levels. However, traders should watch for a slowdown in the histogram bars, which could indicate weakening momentum.
RSI (Relative Strength Index): The RSI is at 63.94, approaching the overbought zone (70) but still maintaining room for further upside. This indicates that the bullish momentum remains strong, though traders should remain cautious of potential pullbacks if the RSI reaches overbought conditions.
Support and Resistance Levels:
Support: The closest support lies at 1.0370 (50% Fibonacci retracement level), followed by 1.0290 (38.2% Fibonacci level). These levels may act as potential rebound zones in case of a pullback.
Resistance: The immediate resistance stands at 1.0485 (100% Fibonacci retracement level), followed by 1.0530, a key psychological resistance zone and a recent price peak.
Conclusion and Consideration:
The EUR/USD H4 analysis confirms a strong bullish trend, supported by the break above the 61.8% Fibonacci retracement level, bullish MACD crossover, RSI strength, and Parabolic SAR dots positioned below the price candles. These indicators suggest that further upside potential remains, with the 1.0485 resistance level (100% Fibonacci retracement level) as the next key target. However, traders should be cautious as the U.S. Retail Sales, Import Price Index, and Industrial Production reports could introduce volatility and impact the USD’s strength. A stronger-than-expected U.S. economic performance could trigger short-term pullbacks in EUR USD, offering potential buying opportunities at key support levels.
Disclaimer: The analysis provided for EUR/USD is for informational purposes only and does not constitute investment advice. Traders are encouraged to perform their own analysis and research before making any trading decisions on EURUSD. Market conditions can change quickly, so staying informed with the latest data is essential.
FXGlory
02.14.2025