Time Zone: GMT +2
Time Frame: 4 Hours (H4)
Fundamental Analysis:
The GBPUSD pair is poised for volatility due to several key economic releases today. For the British Pound (GBP), the RICS Housing Price Balance report could influence market sentiment as it serves as an early indicator of housing inflation trends. Additionally, upcoming GDP, Construction Output, Trade Balance, and Industrial Production reports in the following days will further shape market expectations regarding the UK economy.
On the US Dollar (USD) side, a press conference by US President Donald Trump and a speech by Federal Reserve Governor Christopher Waller about stablecoins could introduce significant market movement. Additionally, US Producer Price Index (PPI) data is scheduled, serving as a leading indicator of inflation. The combination of UK economic reports and US policy discussions may drive volatility in the GBPUSD pair, making price action highly reactive to today’s scheduled events.
Price Action:
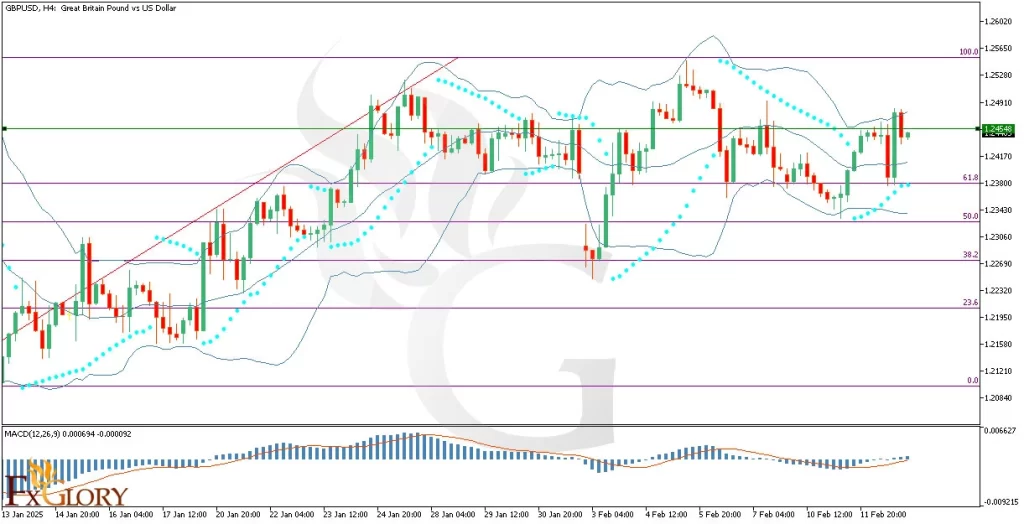
On the GBPUSD H4 chart, the price has been fluctuating between Fibonacci retracement levels, indicating a mix of bullish and bearish pressure. Recently, a bullish recovery has been observed as the GBP/USD price approaches a key resistance level. The market sentiment suggests buyers are attempting to push the price higher, though a strong breakout is required to confirm further upside momentum. Candlestick formations suggest increased volatility, with recent wicks showing both buying and selling pressure.
Key Technical Indicators:
Bollinger Bands: The price recently touched the upper Bollinger Band and pulled back slightly, suggesting resistance at this level. Currently, the price is once again moving closer to the upper band, indicating a potential continuation of the bullish momentum. If the GBP USD price breaks above the band with high volume, it could signal an expansion in volatility and further upside movement.
Parabolic SAR: The Parabolic SAR dots (aqua-colored) are positioned below the candles, indicating an ongoing bullish trend. The consecutive SAR dots below price action provide confirmation that buyers are in control. However, if the dots shift above the GBP-USD price, it may signal a reversal or a period of consolidation.
MACD (Moving Average Convergence Divergence): The MACD histogram is currently positive, indicating bullish momentum. The MACD line is above the signal line, suggesting continued upward pressure. However, the momentum appears moderate, meaning traders should monitor for any signs of divergence or a bearish crossover that could indicate a potential reversal.
Support and Resistance Levels:
Support: The nearest support level is at 1.2340, aligning with the 61.8% Fibonacci retracement level, which has acted as a strong demand zone.
Resistance: The key resistance level is at 1.2490, where the price has faced rejection multiple times. A breakout above this level could open the door for further upside movement.
Conclusion and Consideration:
The GBPUSD H4 analysis suggests bullish momentum, supported by Bollinger Bands, Parabolic SAR, and MACD indicators. However, resistance at 1.2490 remains a key hurdle for further price appreciation. With important UK and US economic data releases today, traders should expect increased volatility. A break above resistance could confirm further bullish momentum, while failure to do so may result in a pullback towards key support levels.
Disclaimer: The analysis provided for GBP/USD is for informational purposes only and does not constitute investment advice. Traders are encouraged to perform their own analysis and research before making any trading decisions on GBPUSD. Market conditions can change quickly, so staying informed with the latest data is essential.