Time Zone: GMT +2
Time Frame: 4 Hours (H4)
Fundamental Analysis:
The USDCAD currency pair may see heightened volatility today and in the coming sessions due to a series of scheduled US and Canadian economic events. On the US side, traders will look closely at upcoming Consumer Price Index (CPI) releases on March 12, 2025, as well as comments from Federal Reserve Chair Jerome Powell and other FOMC members, which can offer critical clues on the US interest rate path. Meanwhile, the Canadian Dollar (CAD) could react significantly to the Bank of Canada (BOC) Minutes release set for March 26, 2025, and crude oil inventory reports given Canada’s sizable energy sector. These factors, combined with ongoing market sentiment around inflation and economic growth, may create a catalyst for a new price direction on the USD-CAD H4 chart.
Price Action:
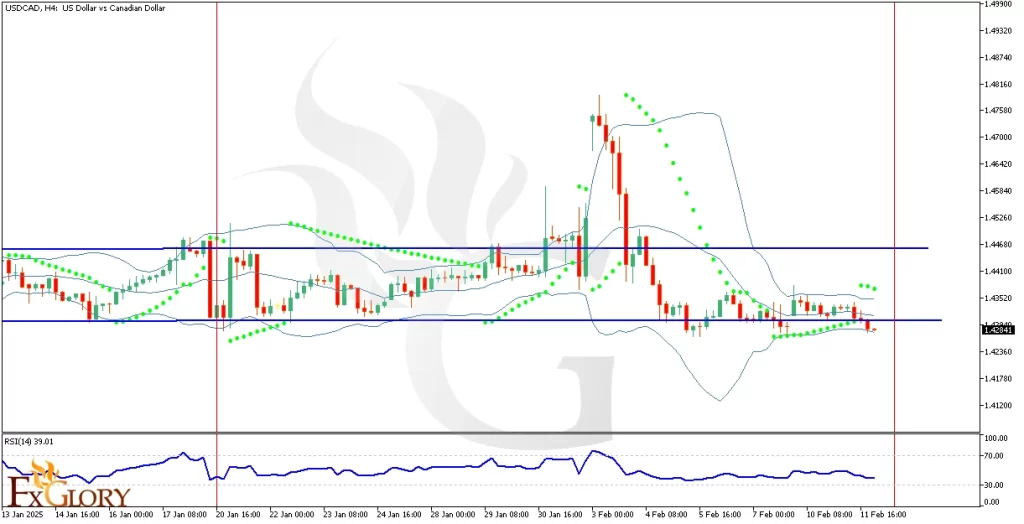
The USD/CAD chart shows that the pair has been stuck for quite some time in a range channel (as indicated by the two blue horizontal lines). A recent breakout attempt above the channel failed, and price action has since retested the lower boundary twice, hinting at building downside pressure. The red cycle line visible on the chart suggests the timing for a new directional move may be near, and the formation of consecutive bearish candles signals a rising possibility of a sustained break below the channel support. Traders should monitor how the pair behaves around this critical zone, as a confirmed break could trigger a fresh downward trend.
Key Technical Indicators:
Bollinger Bands: The three Bollinger Bands on the USD-CAD chart (the moving average center line, plus the upper and lower standard deviation lines) have converged closer together, indicating a period of lower volatility. Such tightening bands frequently precede a breakout move, highlighting the potential for a strong price action shift once volatility returns. The price has gravitated near the lower Band in recent sessions, reflecting a growing bearish bias. This contraction phase can end abruptly if the pair breaks convincingly below the channel support.
Parabolic SAR: The last three Parabolic SAR dots have formed above the most recent candles, illustrating that downside momentum is beginning to dominate. When the dots remain above price bars, it typically suggests a short-term downtrend. A continuation of this pattern will reinforce bearish sentiment and further align with the notion of a pending channel breakdown. Traders often look for price and Parabolic SAR alignment to confirm momentum direction.
RSI (Relative Strength Index): The RSI reading near 39 indicates that momentum is leaning to the downside without having reached oversold territory yet. An RSI below 50 generally reflects a bearish outlook, though there is still room for additional selling pressure before oversold conditions emerge. If RSI continues to drop, it could validate increased bearish control. Conversely, a move back above 50 might signal a swing in momentum favoring buyers.
Support and Resistance:
Support: Immediate support rests around the 1.4230 level, the lower boundary of the established price channel. A decisive close below this threshold could open the door toward the 1.4100 mark, which stands as the next notable support.
Resistance: Key resistance is observed near 1.4450, aligning with the channel’s upper boundary. An additional resistance hurdle waits around 1.4700, which coincides with prior swing highs and could test bullish commitments if price surges upward.
Conclusion and Consideration:
The USD Vs. CAD pair appears poised for a potential breakout from its prolonged consolidation, and current technical indicators skew bearish. While a downside break remains likely given the failed attempt to breach the channel top and repeated tests of the lower boundary, major fundamental releases—such as US CPI and BOC Minutes—could inject sudden volatility and shift momentum. Traders conducting a technical and fundamental chart daily analysis for USDCAD should monitor both the market’s reaction to upcoming news and the price action around critical support and resistance levels. Caution and diligent risk management remain key, especially if a definitive channel break to the downside materializes.
Disclaimer: The analysis provided for USD/CAD is for informational purposes only and does not constitute investment advice. Traders are encouraged to perform their own analysis and research before making any trading decisions on USDCAD. Market conditions can change quickly, so staying informed with the latest data is essential.