Time Zone: GMT +2
Time Frame: 4 Hours (H4)
Fundamental Analysis:
The GBP/USD currency pair represents the exchange rate between the British Pound (GBP) and the US Dollar (USD), a popular forex pair due to its volatility and liquidity. Today’s economic calendar highlights several key events that could influence GBP USD forex pair. On the USD side, PMI figures for both manufacturing and services, along with home sales data, provide critical insights into the economic outlook. Robust PMI readings could strengthen the dollar by signaling economic expansion. Meanwhile, the UK releases include consumer confidence and PMI data, which are crucial for understanding market sentiment toward the Pound. Positive GfK consumer confidence and manufacturing PMI data could provide a boost to GBP, while weaker-than-expected figures could weigh on its performance.
Price Action:
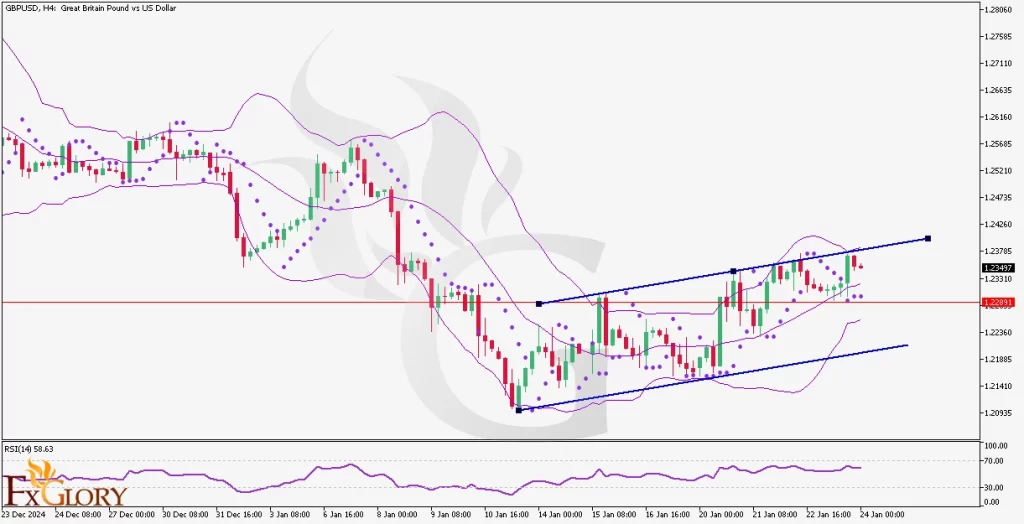
The GBPUSD pair has been trading within a slight bullish channel, gradually climbing from its lower boundary toward the upper boundary. Currently, the GBP-USD price has bounced from the middle Bollinger Band and reached the upper band, though the last two candlesticks are red, indicating a potential pullback or consolidation. The overall price movement reflects steady upward momentum, but bearish candlesticks suggest sellers are testing the upper boundary’s strength.
Key Technical Indicators:
Bollinger Bands: The Bollinger Bands indicate a mild bullish trend, with the GBP/USD price moving from the middle band toward the upper band. The last two bearish candles after touching the upper band suggest a possible retracement toward the middle band or consolidation around current levels.
Parabolic SAR: The Parabolic SAR shows an upward bias, with its last three dots positioned below the candles, supporting the ongoing bullish trend. However, traders should monitor closely for any reversal in the SAR placement, as it could signal a weakening trend.
RSI (Relative Strength Index): The RSI is currently at 58.63, suggesting a neutral-to-bullish momentum. It indicates that the market still has room to rise without being overbought, though the slight decline reflects the GBP USD pair’s recent bearish candlesticks.
Support and Resistance:
Support: Immediate support is located at 1.2280, which aligns with the middle Bollinger Band and a recent consolidation area. Further support lies at 1.2200, the lower boundary of the ascending channel and a psychological level.
Resistance: The nearest resistance level is at 1.2350, coinciding with the upper boundary of the ascending channel. A stronger resistance is at 1.2400, aligning with recent highs and acting as a psychological barrier.
Conclusion and Consideration:
The GBPUSD pair on the H4 chart is showing a gradual bullish trend within an ascending channel, supported by technical indicators such as Bollinger Bands and Parabolic SAR. However, the red candles near the upper Bollinger Band suggest a possible pullback or consolidation. RSI readings indicate room for further upward movement, though traders should remain cautious of potential reversals.
Today’s news releases, particularly the US and UK PMI figures, along with consumer confidence data, could introduce significant volatility. A strong PMI from the US could pressure GBP-USD lower, while upbeat UK data may provide further support for the Pound. Traders are advised to closely monitor the upcoming news and consider key support and resistance levels when making trading decisions.
Disclaimer: The analysis provided for GBP/USD is for informational purposes only and does not constitute investment advice. Traders are encouraged to perform their own analysis and research before making any trading decisions on GBPUSD. Market conditions can change quickly, so staying informed with the latest data is essential.


