Time Zone: GMT +2
Time Frame: 4 Hours (H4)
Fundamental Analysis:
The USDJPY pair is trading in a dynamic environment, influenced by the World Economic Forum (WEF) meetings scheduled today. Comments from central bankers and policymakers during this event could trigger significant market volatility for both the USD and JPY. Meanwhile, a U.S. bank holiday for Martin Luther King Jr. Day is expected to reduce liquidity, potentially leading to erratic price swings. On the JPY side, market sentiment may be shaped by the release of machine orders and industrial production data from Japan. These indicators, key measures of economic activity, could provide insights into the health of the Japanese economy and its impact on the yen.
Price Action:
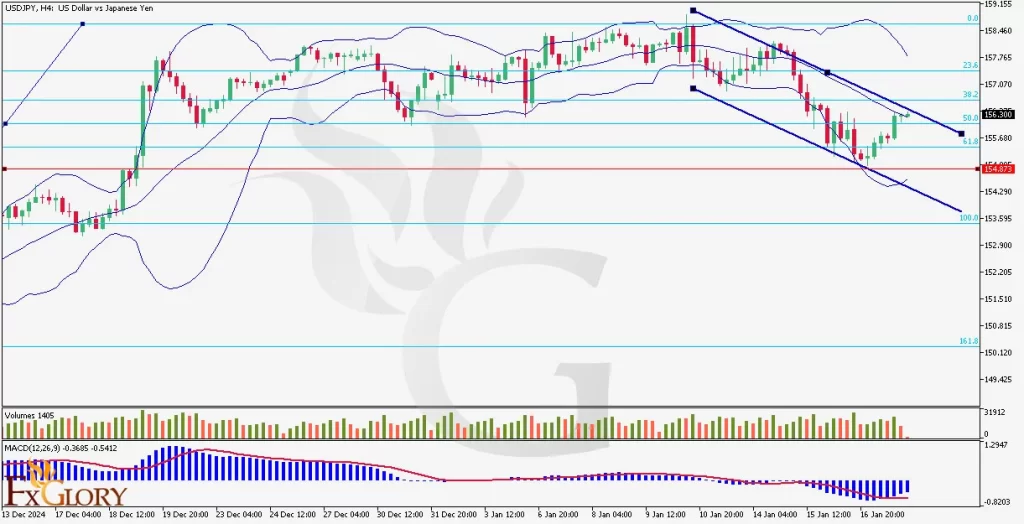
The USD/JPY pair in the H4 timeframe is showing growth within a bullish trend, with 6 bullish candles in the last 7. Following a recent downtrend channel, the USD JPY price has managed to break the 50% Fibonacci retracement level and is now testing the 156.300 resistance level. Although the current momentum favors bulls, the price faces potential consolidation near this zone as the market awaits further fundamental triggers.
Key Technical Indicators:
Bollinger Bands: The Bollinger Bands initially expanded during the recent bearish move but are now narrowing as the price stabilizes. The current candle is trading near the middle band, indicating a possible slowdown in momentum as the pair seeks direction.
MACD: The MACD line is gradually approaching the signal line from below, while the histogram reflects diminishing bearish momentum. A bullish crossover is likely if upward pressure continues, signaling stronger buying interest.
Volume: Trading volumes have been tapering off slightly, suggesting reduced market participation due to the U.S. holiday. However, any breakout from key levels could attract renewed interest.
Support and Resistance:
Support: Immediate support is located at 156.300, which aligns with the middle Bollinger Band and the 50% Fibonacci retracement level, acting as a key area for price consolidation. Secondary support is found at 154.873, corresponding to the 61.8% Fibonacci retracement and a recent price low.
Resistance: The nearest resistance level is at 157.600, coinciding with the upper boundary of the descending channel and a key psychological level. Further resistance is located at 159.460, aligning with the 23.6% Fibonacci retracement level and previous swing highs.
Conclusion and Consideration:
The USDJPY pair on the H4 chart shows signs of recovery within a broader bullish framework. The narrowing Bollinger Bands, combined with a potential MACD crossover, suggest a period of consolidation or a breakout on the horizon. Traders should watch for volatility stemming from the World Economic Forum and Japanese economic releases, which could push the USD-JPY pair decisively through support or resistance levels. Given the low liquidity caused by the U.S. bank holiday, irregular volatility should be anticipated.
Disclaimer: The analysis provided for USD/JPY is for informational purposes only and does not constitute investment advice. Traders are encouraged to perform their own analysis and research before making any trading decisions on USDJPY. Market conditions can change quickly, so staying informed with the latest data is essential.


