Time Zone: GMT +2
Time Frame: 4 Hours (H4)
Fundamental Analysis:
Bitcoin (BTC) has seen a significant decline in recent days following a broad sell-off in the cryptocurrency market. The bearish sentiment in BTCUSD coincides with a strengthening US Dollar (USD), driven by improved economic confidence indicators such as the US CB Consumer Confidence report expected later today. A higher-than-forecast result could further bolster the USD, applying downward pressure on BTC USD. Additionally, market participants remain cautious ahead of the next Federal Reserve meeting, which could reinforce the dollar’s strength amid continued inflation concerns and higher interest rates. For Bitcoin, macroeconomic factors such as regulatory developments and adoption trends remain pivotal, but short-term trading may hinge on USD strength and risk sentiment.
Price Action:
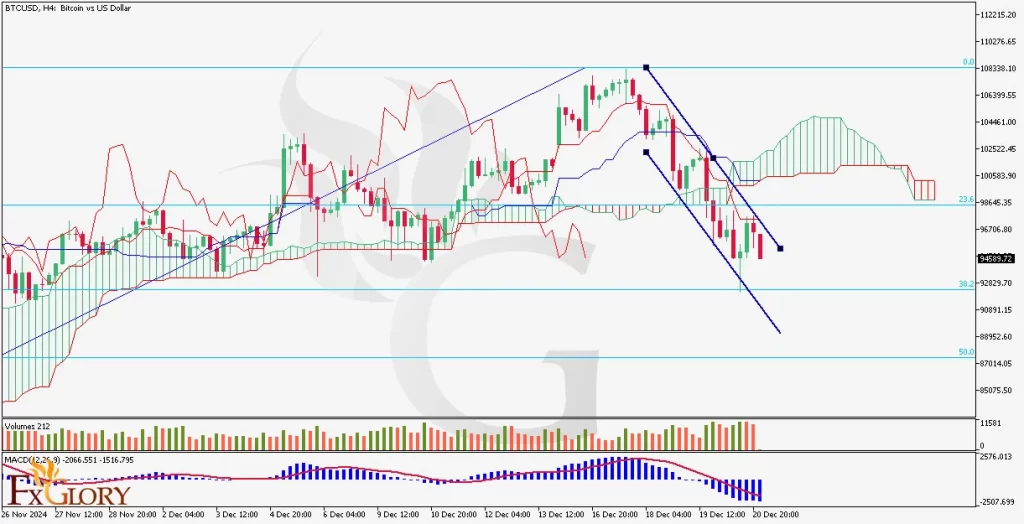
The BTC/USD pair on the H4 timeframe reveals a sharp bearish trend. After reaching a significant high earlier in the month, the price has entered a pronounced downward channel. The formation of consecutive bearish candles with intermittent bullish corrections reflects persistent selling pressure. Notably, the price broke below the Ichimoku Cloud and the 23.6% Fibonacci retracement level, signaling a transition to bearish dominance. Currently, the pair is testing the 38.2% Fibonacci retracement level, which serves as a critical support zone.
Key Technical Indicators:
Ichimoku Cloud: The BTC/USD price has decisively broken below the Ichimoku Cloud, confirming bearish momentum. The lagging span is below the price action, and the cloud ahead is bearish (red), indicating further downside potential unless the price reclaims key levels above the cloud.
Volumes: Trading volumes indicate strong selling activity. The spikes in volume accompanying bearish candles suggest heightened bearish sentiment, while lower volumes during bullish retracements reflect weak buying interest. This supports the continuation of the downward trend.
MACD: The MACD line is well below the signal line, and the histogram shows increasing bearish momentum. The deepening divergence between the MACD and signal lines indicates that the bearish trend is gaining strength, with no immediate signs of a reversal.
Support and Resistance:
Support Levels: The first key support level is located at the 38.2% Fibonacci retracement level, which stands at $92,829.72. A further decline could see the price testing the next significant support at the 50.0% Fibonacci retracement level near $87,014.05, marking a critical zone for buyers to step in.
Resistance Levels: The immediate resistance is positioned at the 23.6% Fibonacci retracement level of $98,645.35, which needs to be reclaimed to reduce bearish pressure. Beyond this, a stronger resistance awaits near $102,522.45, aligning with the upper boundary of the Ichimoku Cloud and previous support levels.
Conclusion and Consideration:
The BTC/USD pair in the H4 timeframe remains firmly in a bearish trend. Key technical indicators, including the Ichimoku Cloud, MACD, and Fibonacci levels, all point to sustained downward pressure. However, the upcoming US CB Consumer Confidence report may cause additional volatility, as positive data for the USD could weigh further on BTC-USD. Traders should monitor key support levels such as $92,829.72 and $87,014.05 for potential breakdowns or signs of reversal. Conversely, a recovery above the 23.6% Fibonacci level and the Ichimoku Cloud would be necessary to challenge the current bearish outlook.
Disclaimer: The analysis provided for BTC/USD is for informational purposes only and does not constitute investment advice. Traders are encouraged to perform their own analysis and research before making any trading decisions on BTCUSD. Market conditions can change quickly, so staying informed with the latest data is essential.


