Time Zone: GMT +2
Time Frame: 4 Hours (H4)
Fundamental Analysis:
The AUD/USD news analysis today shows the Australian Dollar (AUD) continues to be influenced by key economic data releases, particularly from China, its largest trading partner, as well as the global economic outlook. The USD is influenced by key macroeconomic events, including the release of US employment data and speeches from Federal Reserve officials. The Automatic Data Processing (ADP) report on US employment, set to be released today, could have a strong impact on USD strength, as a positive result would reinforce expectations of a tighter monetary policy from the Federal Reserve. Additionally, Australian GDP data released recently has shown modest growth, suggesting that the economy remains stable, though inflationary pressures could weigh on the AUD in the near term, affecting the AUD/USD bias.
Price Action:
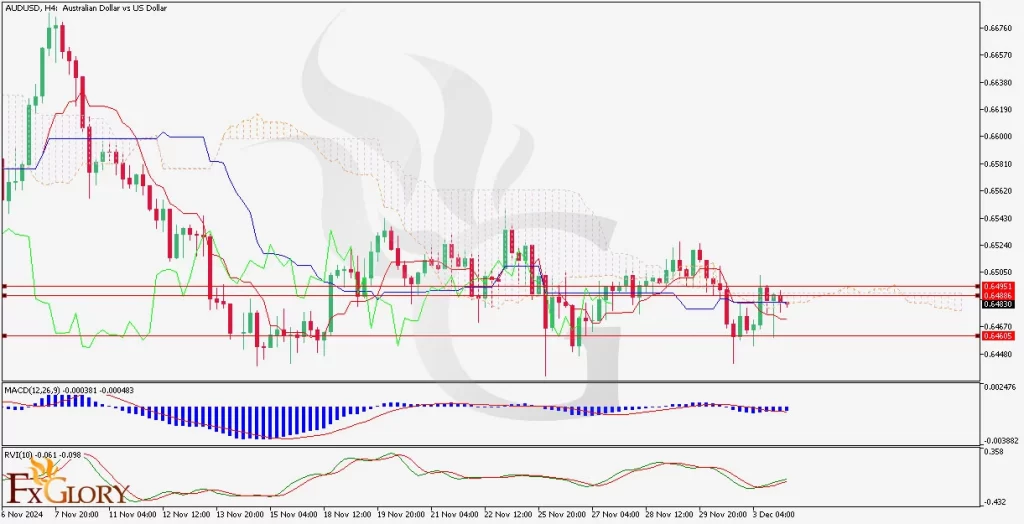
The AUD/USD technical analysis today is currently showing mixed signals. The pair’s price action has been fluctuating between support and resistance levels, with a recent failure to break above the key resistance zone. The price is currently testing the lower edge of the Ichimoku Cloud, which acts as a dynamic support and resistance zone. In recent hours, the pair has been consolidating within a defined range, signaling uncertainty as traders await fresh direction from upcoming US economic data releases.
Key Technical Indicators:
Ichimoku Cloud: The AUD/USD price is currently situated near the lower boundary of the Ichimoku Cloud, signaling potential support. A break below the cloud would indicate further bearish momentum, while a bounce could lead to a rally towards the top of the cloud, currently around the 0.6800 level.
RVI (Relative Vigor Index): The RVI is currently above the 50 mark, indicating a bullish momentum, though not yet overextended. The indicator is showing some divergence, which could signal the possibility of a shift in market sentiment. If RVI continues rising, the pair may attempt a breakout above current resistance levels.
MACD (Moving Average Convergence Divergence): The MACD shows a neutral stance with the MACD line hovering near the signal line. This suggests indecision in the market, with no clear bullish or bearish trend. Traders should watch for a potential crossover, which could give further clarity on short-term direction.
Support and Resistance:
Support Levels: The 0.6700 level, which has held as a strong support zone, is critical for the pair. If price breaks below this level, we could see a move towards the 0.6650 zone.
Resistance Levels: The 0.6800 level remains the nearest resistance, followed by 0.6850. A decisive breakout above these levels could signal the resumption of a bullish trend.
Conclusion and Consideration:
The AUD/USD analysis today on its H4 chart indicates a consolidation phase, with key support at 0.6700 and resistance at 0.6800. The indicators show a neutral to mildly bullish bias, with RVI and MACD signaling potential upside, but the price remains constrained within the Ichimoku Cloud. Traders should watch the upcoming ADP employment report and speeches from Fed officials for direction, as these could heavily influence the USD and thus affect the AUDUSD forecast today. A breakout above 0.6800 could signal a bullish continuation, while a breakdown below 0.6700 would favor the bears. Risk management should be a priority, particularly with economic uncertainty in both the US and Australia.
Disclaimer: The analysis provided for AUD/USD is for informational purposes only and does not constitute investment advice. Traders are encouraged to perform their own analysis and research before making any trading decisions on AUDUSD. Market conditions can change quickly, so staying informed with the latest data is essential.


