Time Zone: GMT +2
Time Frame: 4 Hours (H4)
Fundamental Analysis:
The British Pound (GBP) and US Dollar (USD) are both influenced by key economic data releases today. For GBP, the highlight is the upcoming release of the UK Purchasing Managers’ Index (PMI) for the construction sector. A result above 50.0 will signal economic expansion and likely support a stronger GBP. Additionally, external member of the Bank of England’s (BOE) Monetary Policy Committee, Megan Greene, is participating in a discussion on global economic growth, and any hawkish comments could further boost GBP sentiment. For the USD, economic data such as initial jobless claims and trade balance figures will influence investor sentiment. A lower-than-expected jobless claims reading could indicate strength in the US labor market, which would support the USD. The upcoming data is expected to drive volatility, and traders should watch for any significant deviations from forecasts.
Price Action:
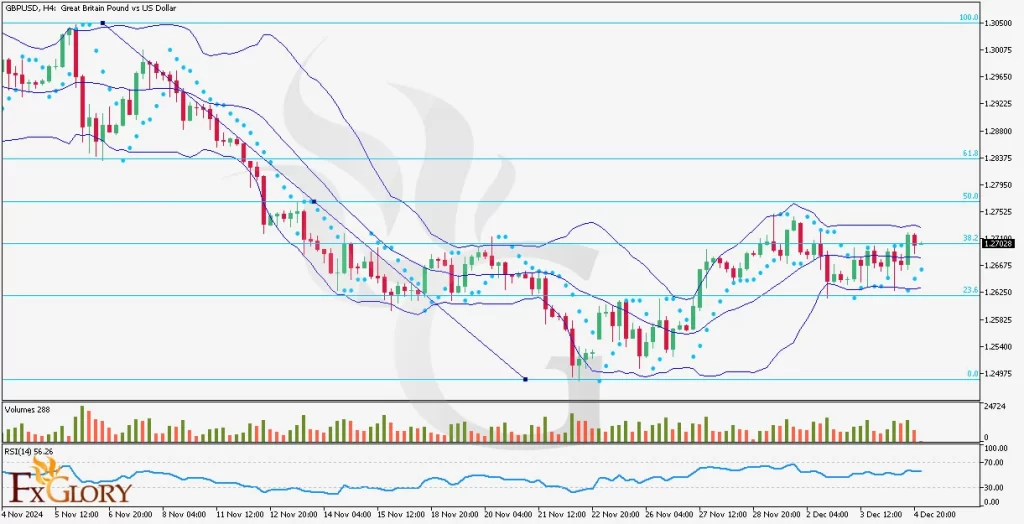
The GBPUSD pair shows a bullish trend on the H4 chart. The price action is moving within an ascending channel, suggesting a steady upward momentum. The most recent candles are forming above the 50-period moving average, signaling the dominance of buyers. The price has consistently been trading within the upper half of the Bollinger Bands, a strong indicator of bullish momentum. However, there have been minor pullbacks, indicating occasional profit-taking or minor consolidation, but these have been short-lived, as the overall bullish bias remains intact.
Key Technical Indicators:
Bollinger Bands: The GBP USD price has been trading in the upper half of the Bollinger Bands for the past few sessions, confirming the prevailing bullish trend. The narrowing of the bands suggests that volatility may decrease temporarily, but a breakout to the upside is still a likely scenario, especially with the price holding strong above the 50-period moving average.
Parabolic SAR: The Parabolic SAR dots are located below the price candles, supporting the bullish trend. The last three dots have appeared below the candles, confirming that the upward momentum is intact, and suggesting minimal risk of a trend reversal in the short term.
RSI (Relative Strength Index): The RSI is currently at 62, indicating that the pair is not yet overbought and has room to move higher. Although the RSI suggests that the market is somewhat bullish, it is not in overbought territory, which means there is still potential for further upside before any pullback might occur.
Support and Resistance:
Support: The immediate support is at 1.2460, where the price recently found support near the 38.2% Fibonacci level. A break below this level could lead to further downside toward 1.2400.
Resistance: The nearest resistance is located at 1.2550, where the price has encountered a few rejections in the past. A break above this level would open up the next resistance zone at 1.2620, which could be targeted if bullish momentum continues.
Conclusion and Consideration:
The GBPUSD pair remains in a solid bullish trend, supported by the Parabolic SAR, RSI, and the overall price action above the 38.2% Fibonacci retracement level. However, traders should be cautious about short-term consolidation, as volatility may decrease ahead of key data releases. The upcoming UK PMI data and Bank of England speaker engagement, alongside USD jobless claims and trade balance figures, could introduce significant market movements. Overall, the bullish trend is likely to continue, but traders should watch for any fundamental surprises that could lead to short-term pullbacks or volatility spikes.
Disclaimer: The analysis provided for GBP/USD is for informational purposes only and does not constitute investment advice. Traders are encouraged to perform their own analysis and research before making any trading decisions on GBPUSD. Market conditions can change quickly, so staying informed with the latest data is essential.


