Time Zone: GMT +2
Time Frame: 4 Hours (H4)
Fundamental Analysis:
The EURUSD pair, reflecting the exchange rate between the Euro and the US Dollar, remains a focus for traders due to upcoming high-impact economic data from both regions. For the Eurozone, recent PMI data reflects contraction in the manufacturing sector, raising concerns about economic stagnation. Unemployment reports from Eurostat provide mixed signals, highlighting limited growth in labor market conditions. For the US Dollar, attention shifts to today’s ISM Manufacturing PMI and Construction Spending data. If these reports exceed expectations, the USD could gain strength, driven by positive economic momentum in the US manufacturing sector.
With divergent economic trajectories, the EURUSD is likely to face significant volatility as traders evaluate the implications of PMI data for future monetary policies by the European Central Bank (ECB) and the Federal Reserve. A stronger-than-expected PMI release from the US could push the EURUSD lower, while weak data could favor the Euro.
Price Action:
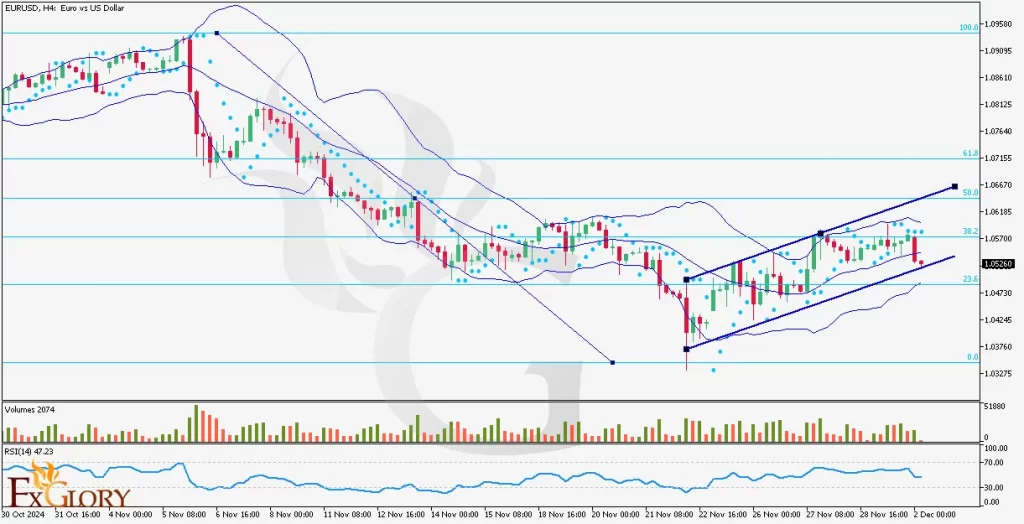
The EURUSD H4 chart indicates a moderately bullish trend within a rising channel. Recent candles show consolidation near the middle Bollinger Band, suggesting a slowdown in bullish momentum. Price action has remained within the upper half of the Bollinger Bands for most of the current trend, confirming positive sentiment. However, the last two candles have shown bearish pressure, with the price nearing the middle band, signaling possible short-term consolidation or retracement.
Key Technical Indicators:
Bollinger Bands: The price has been trading in the upper half of the Bollinger Bands for the past several sessions, reflecting bullish momentum. The recent candles, however, are near the middle band, indicating reduced momentum and potential consolidation. A breakdown below the middle band could lead to further downside toward the lower band.
RSI (Relative Strength Index): The RSI is currently at 47.23, signaling neutral momentum. The indicator is neither overbought nor oversold, suggesting that the EURUSD could move in either direction depending on market sentiment and upcoming data.
Volumes: Volume analysis shows a decline in activity during the recent consolidation phase, reflecting uncertainty in market sentiment. A spike in volume could indicate a breakout in either direction.
Parabolic SAR: Parabolic SAR dots are currently positioned above the price, reinforcing bearish pressure in the short term. A reversal in these dots below the price would signal a renewed bullish trend.
Support and Resistance Levels:
Support: Immediate support is located at 1.0520, aligning with the 23.6% Fibonacci retracement level and serving as a key psychological zone. If this level is breached, the next significant support could be lower, near the 1.0480 area.
Resistance: Intermediate resistance is at 1.0570, corresponding to the 38.2% Fibonacci retracement level, which has acted as a short-term ceiling. Key resistance lies at 1.0618, near the 50.0% Fibonacci level, representing a crucial barrier for further bullish momentum.
Conclusion and Consideration:
The EURUSD H4 analysis suggests that while the pair remains within an ascending channel, the recent price action indicates waning bullish momentum. Traders should watch for a potential breakdown below the middle Bollinger Band, which could lead to a test of the 23.6% Fibonacci support at 1.0520. On the other hand, a bullish breakout above 1.0570 could open the door for further gains toward 1.0618. Upcoming PMI and Construction Spending data will likely dictate near-term direction. Traders should approach with caution and adjust their strategies based on the evolving market environment.
Disclaimer: The analysis provided for EUR/USD is for informational purposes only and does not constitute investment advice. Traders are encouraged to perform their own analysis and research before making any trading decisions on EURUSD. Market conditions can change quickly, so staying informed with the latest data is essential.


