Time Zone: GMT +3
Time Frame: 4 Hours (H4)
Fundamental Analysis:
Today, several key factors influence the USD/CAD pair. U.S. data includes the Producer Price Index (PPI), which is a critical indicator of inflation at the producer level. A higher-than-expected PPI result would likely strengthen the U.S. Dollar, reinforcing expectations for a hawkish Federal Reserve stance. In addition, speeches by Federal Reserve members such as Austan Goolsbee and Michelle Bowman may provide further insight into the Fed’s monetary policy, impacting USD strength. On the CAD side, economic activity will be affected by labor market data, including employment change and unemployment rates. If Canadian data disappoints, it could weigh on the Canadian dollar, pushing the USD/CAD pair higher.
Price Action:
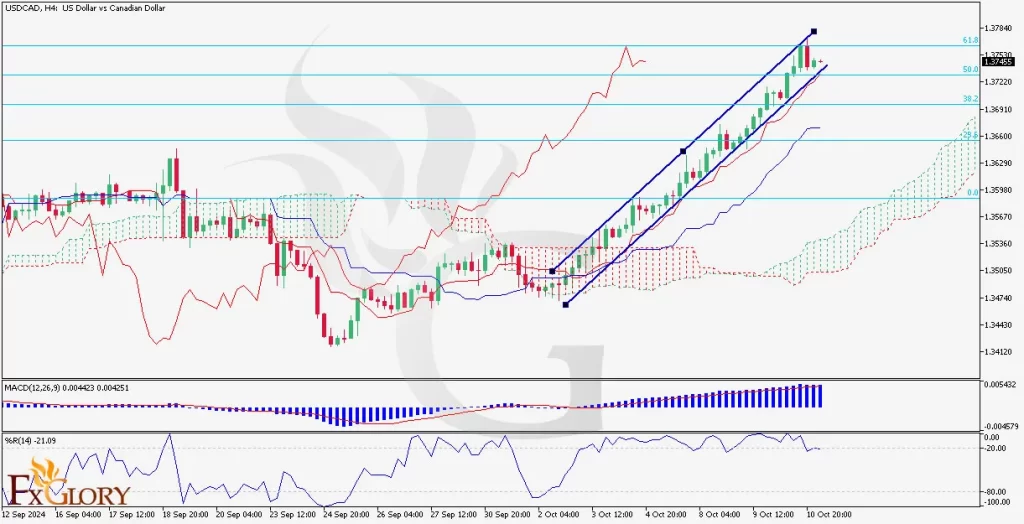
In recent days, the USDCAD pair has been in a strong uptrend, consistently making higher highs and higher lows. The price is moving within an ascending channel, as seen in the H4 timeframe, with momentum driving the pair above the key Fibonacci retracement levels. A minor pullback is observed at the upper boundary of the channel, but bullish momentum remains strong as the pair continues trading above the 50% Fibonacci retracement.
Key Technical Indicators:
Ichimoku Cloud: The price is trading well above the Ichimoku Cloud, confirming a strong bullish trend. Both the Tenkan-sen and Kijun-sen lines are pointing upwards, reinforcing the positive momentum. The Chikou Span also confirms the bullish trend as it stays above the price action, indicating that the trend is likely to continue in the near term.
MACD (Moving Average Convergence Divergence): The MACD line remains above the signal line, confirming ongoing bullish momentum. However, the MACD histogram is starting to flatten, suggesting that the momentum might be weakening slightly. Traders should be cautious of a possible bearish crossover, which could indicate a slowing trend.
Williams %R: The Williams %R indicator is currently approaching overbought territory, indicating that the USDCAD pair could be overextended in the short term. While this reflects strong buying pressure, it also signals a possible correction. A move below the -20 level may signal the beginning of a pullback.
Support and Resistance Levels:
Support: The nearest support level is located at 1.3700, which aligns with the 50% Fibonacci retracement level and the lower bound of the ascending channel. A further decline may find stronger support at 1.3650, which is close to the 38.2% Fibonacci retracement.
Resistance: The immediate resistance is at 1.3780, near the recent highs. A break above this level could push the pair towards 1.3830, which aligns with the 61.8% Fibonacci retracement level and the top boundary of the current channel.
Conclusion and Consideration:
The USDCAD pair on the H4 chart remains in a strong bullish trend, supported by the Ichimoku Cloud, MACD, and Williams %R indicators. While the pair shows some signs of potential short-term overextension, the broader trend continues to favor the bulls. Traders should keep an eye on today’s USD and CAD economic releases, which could drive further volatility, particularly if U.S. PPI data or Fed member speeches signal a hawkish stance. As always, keeping track of key support and resistance levels will be crucial for managing risk and identifying potential trading opportunities.
Disclaimer: This analysis of USDCAD is intended for informational purposes only and does not constitute financial advice. Currency trading involves significant risk, and market conditions can change rapidly. Traders should perform their own research and analysis before making any trading decisions.